29
4.9. SPC
The X Bar-R Chart of the yield and force of the connector production process further controls the production
parameter control to achieve the best production status.
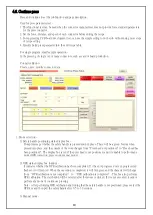
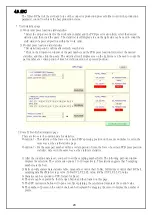
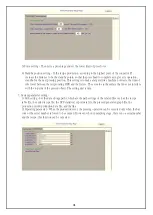
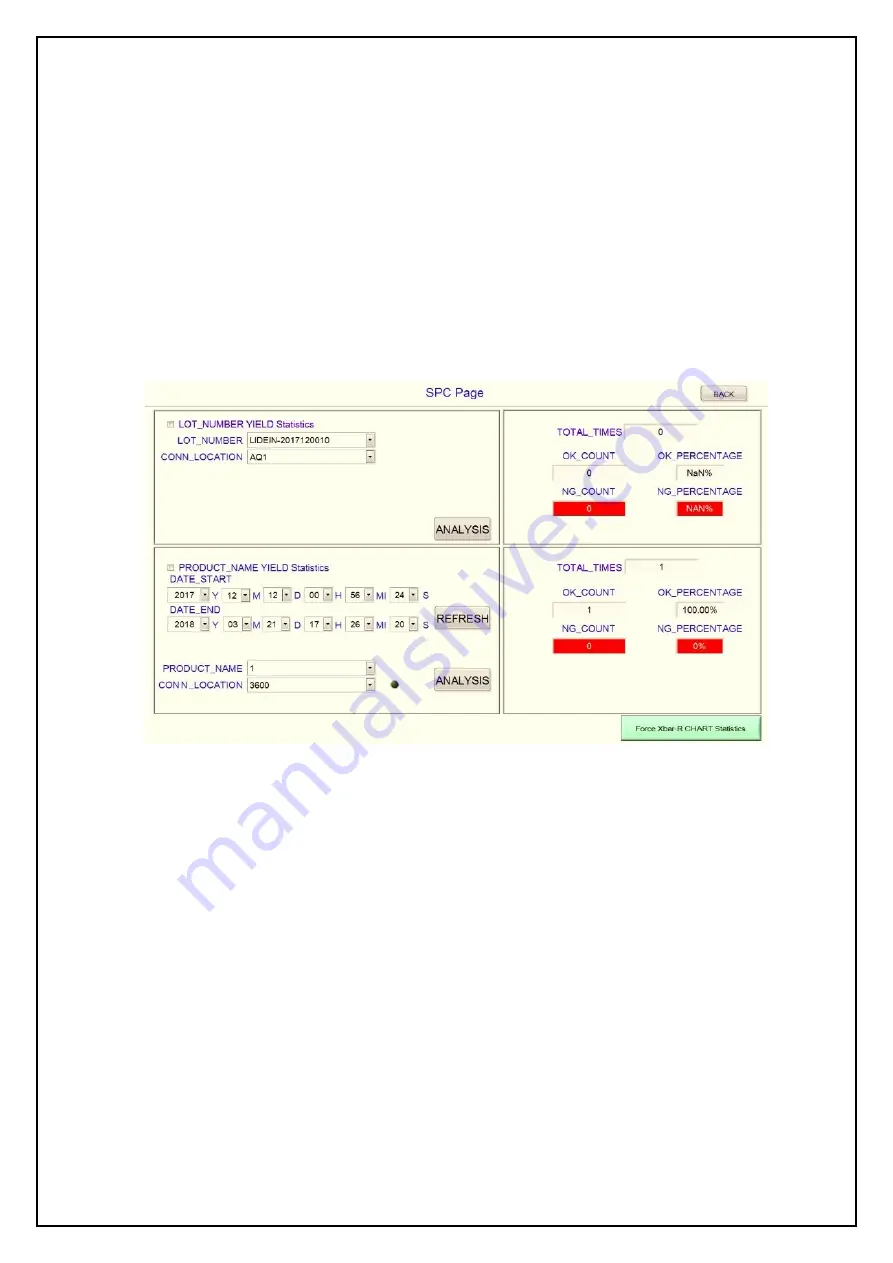
1. Yield statistics page
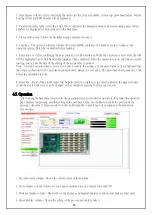
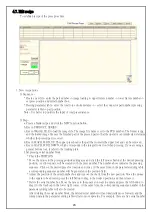
1) Work order press location yield statistics-
* Select the drop-down list for the work order number and the PCB press location field, select the desired
statistics, and then click the query. The statistical result display area on the right side can be used to count the
yield status of a pressed position within the work order.
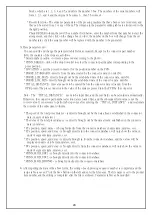
2) Product press location yield statistics
* Set statistical period, confirm after refresh, search data
* Click on the drop-down window of the part number and the PCB press location field, select the desired
statistics, and then click the query. The statistical result display area on the right side can be used to count the
part number at a certain period of time for yield condition of a pressed position.
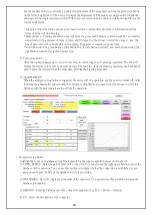
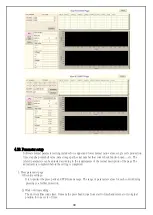
2. Force X Bar-R chart statistics page
There are two sets of condition data for statistics.
Condition 1 - The statistics of the force of a certain PCB's pressing position on the same worksheet is set in the
same way as the yield statistics page.
Condition 2 - For the same part number within a certain period of time, the force of a certain PCB press position
statistics, data set in the same way as the yield rate statistics.
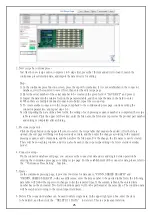
1) After the condition data is set, you need to set the sampling number field. The following pull-out window
displays the selection. The system sets options 1 to 10 respectively. This statistic suggests that 5 sampling
numbers are the best.
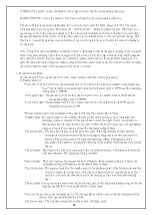
2) Refresh will generate data statistics table, mean value control chart X-Bar, full distance control chart R-Chart,
sampling data Max'Min'Average value, X-Bar UCL'CL'LCL value, R-Chart UCL 'CL'LCL value.
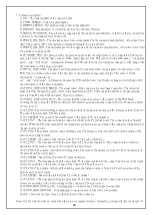
3) Statistics can be exported to CSV format for Excel.
4) The data can be exported by the file open button and then loaded on this page.
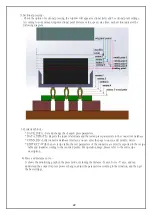
5) The SPC instruction button will open a text file explaining the calculation formula of the control value.
6) The number of points on the control chart can be displayed by dragging the cursor to display the number of
points.

