145
U
sin
g L
o
cati
o
n
D
a
ta
Fu
ncti
o
n
s/
D
ispl
a
yi
ng
M
a
ps
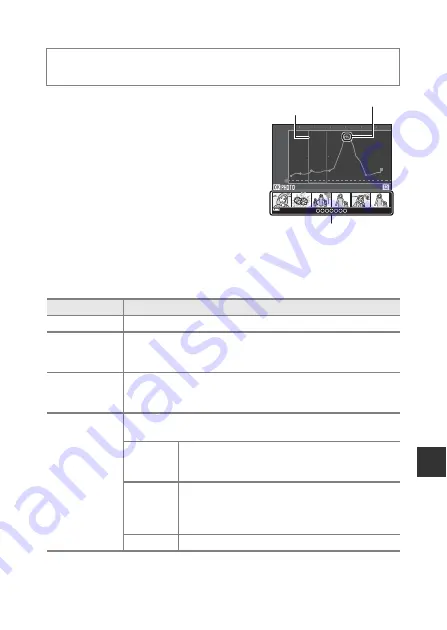
Display Altitude/depth Logs as a Graph
•
Select a log (date) that you want to display
and press the
k
button to display the
altitude or water depth data as a graph.
- The horizontal axis of the graph shows
the total time of log recording, and the
vertical axis of the graph shows the total
variations in altitude/depth during log
recording.
- If images were captured while the log
was being recorded, they are displayed
as thumbnails, and shooting points are
displayed on a graph.
•
Press the
l
button when the log list screen
is displayed to delete the selected log or all saved altitude/depth logs.
•
The operations described below can be performed while a graph is displayed.
Press the
d
button
M
z
(location data options) menu icon
M
View log
M
k
button
M
Altitude/depth logs
M
k
button
Operation
Description
d
button
Return to the log list screen.
Multi selector
Use
JK
to move the yellow selection area.
•
The yellow selection area is displayed when the camera
obtains more than 30 recorded logs.
Zoom control
Move toward
g
(
i
) to zoom in on the area inside the selection area.
•
Use
JK
to move the displayed area.
•
Move toward
f
(
h
) to return to the full graph display.
k
button
Thumbnail images are selected, and operations described
below can be performed.
Multi
selector
Use
JK
to switch the selected image.
•
The shooting point of the selected image
changes to yellow on the graph.
Zoom
control
•
g
(
i
): Display the selected image in full-frame
playback mode.
Use
JK
to display the previous or next image.
•
f
(
h
): Return to the graph display.
k
button
Return to the graph operation screen.
m / time
0
10
20
30
40
50
60
15/11/2015 [2] 15:30
20
40
60
80
100
0
Selection area
Shooting point
Thumbnail display
Summary of Contents for Coolpix AW130
Page 1: ...DIGITAL CAMERA Reference Manual En ...
Page 30: ...xxviii ...


