37
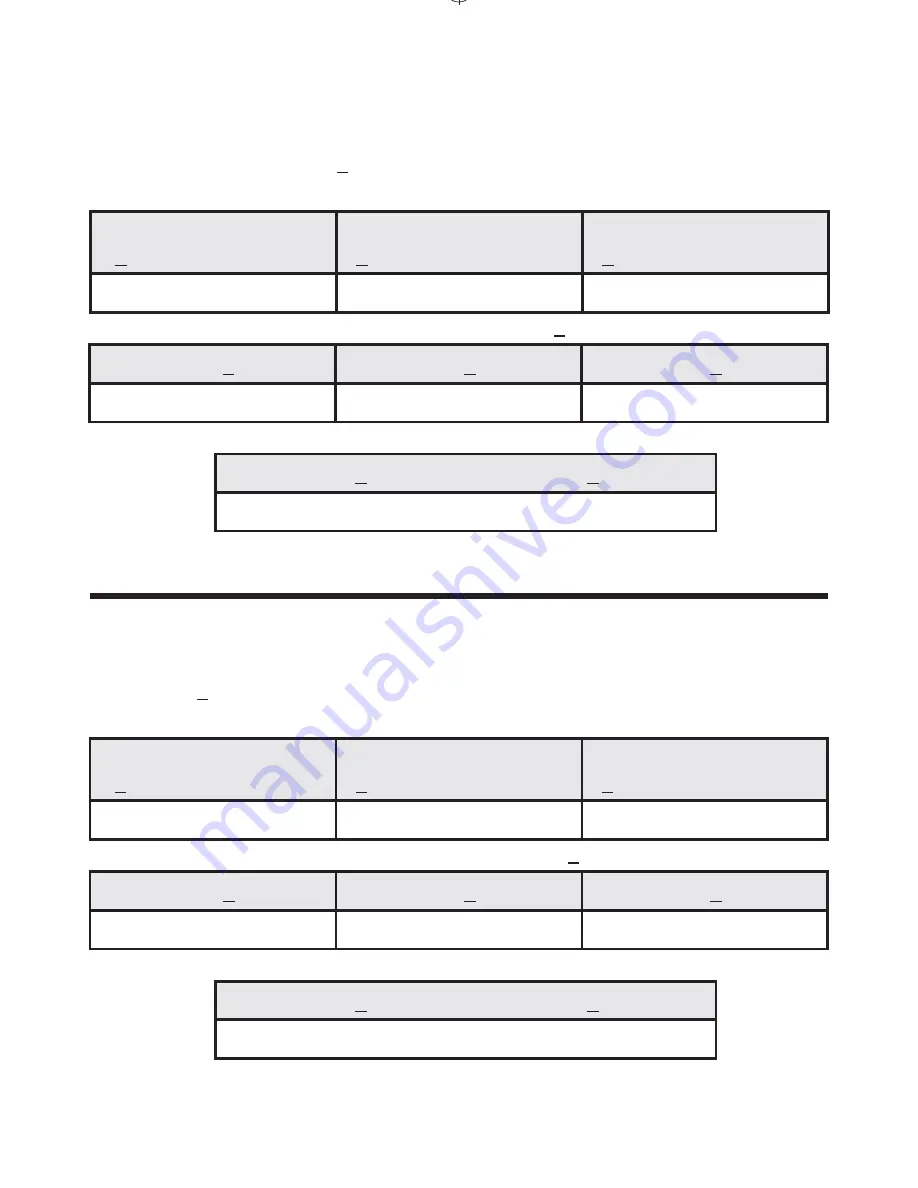
Venous Samples (HCP vs. YSI) for glucose concentrations < 5.55 mmol/L (100 mg/dL)
Within
+ 0.28 mmol/L (5 mg/dL)
Within
+ 0.56 mmol/L (10 mg/dL)
Within
+ 0.83 mmol/L (15 mg/dL)
15/68 (22.1%)
36/68 (52.9%)
62/68 (91.2%)
Venous Samples (HCP vs. YSI) for glucose concentrations > 5.55 mmol/L (100 mg/dL)
5%
10%
15%
130/222 (58.6%)
193/222 (86.9%)
218/222 (98.2%)
Venous Blood
96.6% of TRUEresult twist 2 venous values performed by healthcare professionals (HCP) fell
within 0.83 mmol/L (15 mg/dL) of the YSI results at glucose levels < 5.55 mmol/L (100 mg/dL)
and within 15% at glucose levels > 5.55 mmol/L (100 mg/dL).
Venous Samples for glucose concentrations between 1.1-33.3 mmol/L (20-600 mg/dL)
0.83 mmol/L (15 mg/dL) or + 15%
280/290 (96.6%)
Parkes Error Grid:
99% of individual venous glucose measured values performed by healthcare
professionals fell within Zone A and 1% fell within Zone B of the Parkes Error Grid (PEG).
For Consumers
100% of TRUEresult twist 2 fingertip values performed by users fell within 0.83 mmol/L
(15 mg/dL) of the YSI results at glucose levels < 5.55 mmol/L (100 mg/dL) and within 15% at
glucose levels > 5.55 mmol/L (100 mg/dL).
Fingertip Samples (User vs. YSI) for glucose concentrations < 5.55 mmol/L (100 mg/dL)
Within
+ 0.28 mmol/L (5 mg/dL)
Within
+ 0.56 mmol/L (10 mg/dL)
Within
+ 0.83 mmol/L (15 mg/dL)
6/23 (26%)
19/23 (83%)
23/23 (100%)
Fingertip Samples (User vs. YSI) for glucose concentrations > 5.55 mmol/L (100 mg/dL)
5%
10%
15%
36/77 (47%)
69/77 (90%)
77/77 (100%)
Fingertip Samples for glucose concentrations between 1.1-33.3 mmol/L (20-600 mg/dL)
0.83 mmol/L (15 mg/dL) or + 15%
100/100 (100%)
Parkes Error Grid:
100% of individual fingertip glucose measured values performed by users fell
within Zone A of the Parkes Error Grid (PEG).


