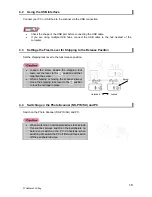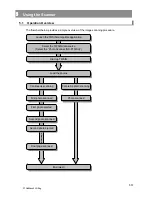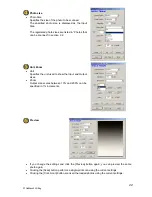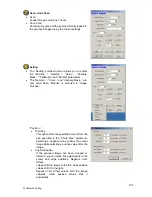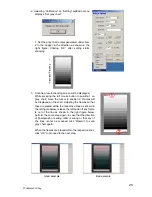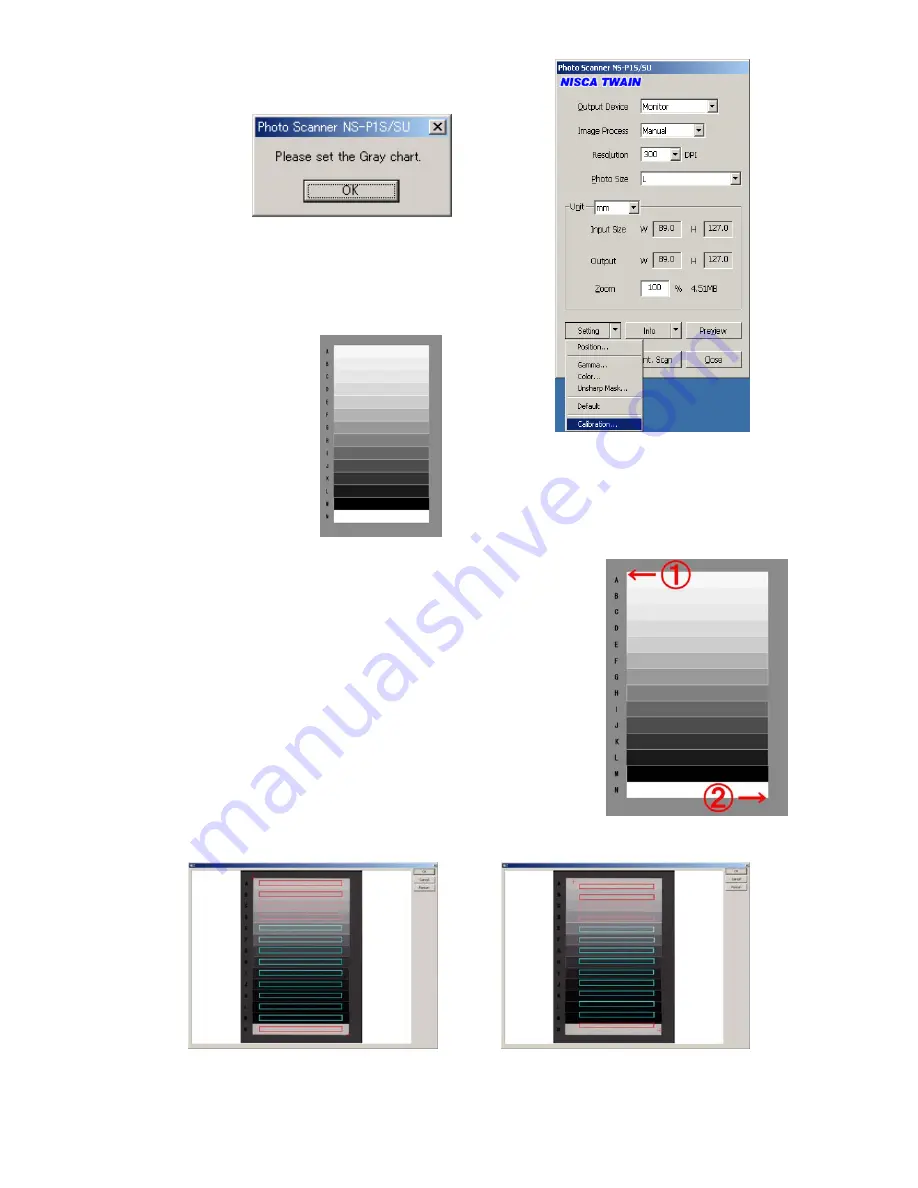
2. Selecting “Calibration” on “Setting” pulldown menu
displays “Set gray chart”.
1. Set the gray chart output generated under item
2 to the hopper in the direction as shown in the
right figure. Clicking “OK” after setting starts
scanning.
←
Feedin
g direction
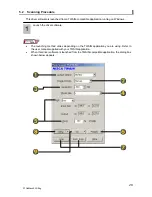
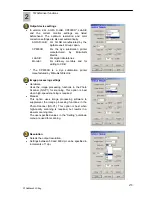
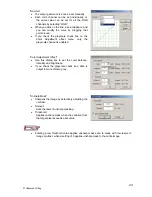
3. Scanning result-checking screen will be displayed.
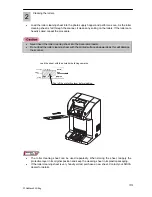
While pressing the left mouse button in position 1 on
gray chart, move the cursor to position 2. Frames will
be displayed on the chart. Adjusting the frames so that
they are placed within the respective lines as shown in
the left figure below, release the left button.If any frame
is out of the line as shown in the right figure below,
perform the same step again. In case that the direction
of photograph or setting order is wrong or that any of
the lines cannot be scanned, click “Rescan” to scan
gray chart again.
When the frames are placed within the respective lines,
click “OK” to proceed to the next step.
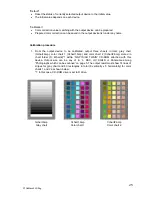
Good example
Bad example
26
P1SeManu220-Eng

