background image

100

Chapter 21

Compensation and correction

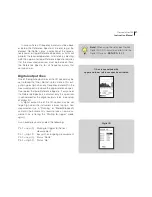
The windscreen correction is adapted to windscreen 
Nor1451. The nominal correction for the windscreen 
correction network is shown in section for specifica-
tions. Press 

SETUP > 1

 (Instr.) 

> 4 

(Input) 

> 2

 (Correct.) 

to gain access to the Corrections menu. Please note 
that you only get access to this menu if the input type is 
set to 

STANDARD

. Navigate in the menu as usual and 

activate the correction parameter Windscr by means 
of the 

INC

 and 

DEC

 keys. Do the similar operation to 

deactivate.

When the windscreen correction is applied, a “

W

” is 

displayed in the lower line of the display.

Compensation 
and correction

Instrument menu

General

Sometimes the accuracy of a measurement can be 
increased if the measurement is corrected or compen-
sated for other known effects. Nor140 has the ability to 
make corrections related to

•  Use of windscreen

•  Measurement of random incidence sound or diffuse 

sound fields

•  Measurement of low levels (Option 18)

Use of windscreen

A microphone windscreen is a useful device for reduc-
ing the noise created around the microphone in windy 
conditions. The windscreen is also useful for protect-
ing the microphone from mechanical impacts and from 
dust. However, the application of a windscreen will 
slightly modify the frequency response of the instru-
ment. To correct for this effect and retain the specifica-
tion the windscreen correction has to be switched on 
while the windscreen is mounted.

Summary of Contents for nor140

Page 1: ...clude third octave filters and statistics in every frequency band multispectrum reverberation time measurements and recording for the measured sound The instrument logs level vs time optional and when it is equipped with multiple time constants and the enhanced profile extension a multitude of functions is logged simul taneously The more than 120dB dy namic range eliminates the need for range sett...

Page 2: ... and or the instrumentation described herein Furthermore Norsonic AS assumes no responsibility for any infringement of the intellectual property rights of third parties wherever applicable which would result from such use Norsonic AS reserves the right to amend any of the infor mation given in this manual in order to take account of new developments If you wish to communicate with us please feel w...

Page 3: ...o address your goals and needs Please let us know how well we succeeded Thank you for choosing Norsonic The Nor140 has been designed to give you many years of safe reliable operation Your approach to the Nor140 documentation de pends on what you want to do and how much you al ready know The Nor140 Instruction Manual is divided into several sections plus an index Each section provides useful and in...

Page 4: ......

Page 5: ...equency analysis 3 Time profile measurements 4 Multispectral measurements 5 Source coding 5 Recording the sound 6 Excellent for noise monitoring 6 The principle of optional extensions 6 Transducers 6 Check which extensions are installed 7 Workload 7 Chapter 2 Taking a closer look at the instrument 10 Switching ON OFF 10 On the use of batteries 10 Low Voltage Situations 11 Marks on the lower line o...

Page 6: ...n 24 Displaying the functions measured 24 Displaying the result tables 25 Statistics displaying the percentiles 26 Displaying the percentiles table 27 Storing the acquired data 27 Printing out the results 27 User defined table 28 Chapter 5 Frequency analysis 29 Setting the measurement duration 29 Statistics 30 Instruments with time profile installed 30 Consider setting the time constant 30 Setting...

Page 7: ...e resolution 49 Measuring in enhanced mode 51 Displaying the functions measured 51 Presenting the L t as a table 51 Chapter 9 Adding markers to a measurement 52 The keys to use 52 Other markers inserted by the instrument 53 Instrument markers have priority 53 Marker overview 53 Chapter 10 Multispectrum measurements 54 Setting up for multispectrum 54 Instruments equipped with basic profile extensio...

Page 8: ...ing folders or the entire memory 69 Chapter 13 Automatic storing of data and noise monitoring 71 Automated storage of measured data 71 Available storage modes 71 Synchro an example 72 Setting the storage mode 73 Chapter 14 Making hardcopies 74 Setting up for printouts 74 Printing out measured data 74 Chapter 15 Transfer of data to a PC 76 Select USB or serial 77 NorXfer installation procedure 77 I...

Page 9: ...89 Recording gain 89 Recording duration 90 Making a recording 90 Setup for a recording 91 Setup how to start a recording 91 Manual trigger 91 External trigger 91 Level above trigger 92 Listening 92 Insert a reference tone as a recording 93 Chapter 19 Reference Spectrum 94 General 94 Activating the Reference Spectrum features 94 Selecting the Reference Spectra 94 Using a previously measured spectru...

Page 10: ...f noise 102 Measurement of high sound levels 102 Chapter 22 Reverberation time measurements 104 What is reverberation time 104 Calculating the reverberation time 105 Measurement with noise excitation 105 Measurement with impulse excitation 106 Measurement with swept sine excitation 107 Implementation in Nor140 108 Excitation signals 109 Minimum reverberation time possible 109 Maximum reverberation...

Page 11: ...125 Specific requirements 126 The K2A factor 126 Approximate method 126 Using reverberation time instead 126 Test room qualification requirements 127 Measuring the sound power 127 Making measurements 127 Background noise 130 Measurement surface 130 Sound power results 131 Chapter 24 Building Acoustics 132 Introduction 132 Terms and definitions for airborne sound insulation 134 Terms and definition...

Page 12: ...level 146 Reverberation time 146 Calculating the Survey result 146 Impact sound insulation according to the French national Standard 147 Calculating the impact sound insulation according to the Engineering method 148 Receiving Room Level 148 Background noise 149 Reverberation time 149 Display of results 149 Alternative national Standards 150 Store and recall 150 Averaging levels from multiple tapp...

Page 13: ...ime 156 Display of results 156 Remote operation from a PC 158 Swept Sine measurement technique 158 Swept Sine measurement of sound level 159 Swept Sine measurement of reverberation time 159 Chapter 25 Speech Intelligibility by STIPA 160 Introduction What is STIPA 160 Speech transmission index STI 160 Development of STI 160 RASTI and STIPA 161 How is STIPA measured 162 CIS 163 Units included in del...

Page 14: ...Chapter 26 FFT measurement mode 171 Introduction 171 How to select the FFT mode 171 Making a measurement 171 Calibration 172 Corrections 172 Storing the result 173 Specification for FFT 173 Chapter 27 Measuring vibration using Nor140 174 Introduction 174 Accelerometer 174 IEPE type 175 Charge type 176 Velocity and displacement 177 Chapter 28 Audiometer calibration 178 Chapter 29 Technical specific...

Page 15: ...Adjustment of indicated levels 185 Windscreen 186 High levels 186 Preamplifier attenuation 187 Self noise compensation 188 Diffraction around the instrument casing 188 Signal output 190 Serial I O port 190 Digital inputs 190 Digital outputs 190 Digital output control lines 191 AC out 192 RPM 192 USB interface 192 SD card 192 Data storage 192 Environmental conditions 192 Warm up time 193 Sensitivit...

Page 16: ......

Page 17: ...nor140 SOUND ANALYSER ...

Page 18: ......

Page 19: ...sure Level LPEAK The Maximum Peak Level The spectral weighting functions A and C or Z weight ing are available for all functions including the LPEAK The Z weighting as specified in IEC 61672 1 replaces Lin or Flat as these have not been properly defined by any standard As an optional extension the instrument functionality can be expanded to include the ability to measure with all three time consta...

Page 20: ...thus covers both the audio and the vibration range Statistics The optional extension 4 adds statistical distribution to the Nor140 functionality There are eight percentiles shown out of which one is freely selecta ble The class width is 0 2 dB over the entire 130 dB range The statistical distribution calculation applies to the spectral weighting networks A and Z or C as well as all the individual ...

Page 21: ...ve band or third octave band measurements the choice is yours depending on how you prefer to con figure your Nor140 The octave band measurements span the range 8Hz to 16 kHz or from 0 5 Hz to 16 kHz dependent on your set up An upgrade to option 3 will provide you with third octave band measurements in the range 6 3 Hz to 20 kHz or from 0 4Hz to 20 kHz The two bandwidths share the type of functions...

Page 22: ...period duration will for all practical cases be determined by your need for time resolution Provide details maintain overview The level vs time feature is the tool you need for detailed analysis of the time profile However a measurement failing to provide an overview of the entire analysis cannot be accepted So we added a global analysis to all time profile measurements It just runs in the backgro...

Page 23: ...ards in 25 ms steps in 1 second steps above 1 second time resolution so beware unless you want to create a busy day for yourself there will easily be quite a lot of data generated so avoid more details than strictly needed Multispectral measurements The Nor140 functionality can be expanded to include multispectral measurements This extension takes the instrument s time profile capabilities to new ...

Page 24: ...d go sessions will after a while experience a small but significant time shift so that each period no longer starts exactly on the hour Enter synchro mode This feature standard in all models stops the measurement on the hour and restart the next measurement a couple of seconds later to provide time for storage By sacrificing a little at the start of a measurement the synchronisation with the time ...

Page 25: ...led the Nor140 instrument has the ability to measure a large number of different functions in addition to sound recording The selection of functions is made by the user through the set up menu system A large number of selected functions combined with very short measurement periods and sound recording may give a workload in excess of the capacity for the signal processor Other factors that may infl...

Page 26: ...f a continuously audio re cording was performed Trigger level of the audio recording Try to avoid a level where your trigger is about equal to the noise level then the trigger will go on off very rapidly causing an increase in the workload Time profile resolution A time profile of high res olution less than 500ms in combination with the above points may cause a workload Number of parameters that i...

Page 27: ...ing require Option 6 Option 9 Reverberation time calculation require Option 1 Option 10 Internal noise generator with white and pink noise signal cables not included Option 11 Complete building acoustic mode in accordance with ISO 10052 and ISO 140 series and sound insulation indexes calculated according to ISO 717 1 and ISO 7171 2 require options 1 3 9 and 10 Option 12 Swept Sine remote measureme...

Page 28: ...cond for switching the instrument OFF On the use of batteries The Nor140 comes with four AA batteries 1 5V each Battery lifetime is typically 8 12 hours depends on measurement mode and brand of batteries If you switch to lithium batteries the life time will increase to 15 20 hours The use of alkaline or lithium batteries is strongly recommended to avoid leakage Rechargeable batteries may also be u...

Page 29: ...g measurement However as the instrument automatically make a backup storage every 2 minutes the last file stored will include the correct results except for maximum the 2 last minutes prior to the power failure Upon return of the external power the instrument will automatically start to measure as if the START key had been pressed If powered from internal batteries and left un attended and unopera...

Page 30: ...the following general guide lines applicable to every Nor140 menu To navigate between editable parameter fields in the menu use the CURSOR keys The editable field currently selected is shown inverted white text on black background Use the INC and DEC keys to increment or decrement the current setting of the param eter Alternatively use the keypad to key in the required value whenever applicable Th...

Page 31: ...s normally 20 µPa for sound pressure levels EU Engineering unit The signal strength is indicated in a generic linear unit The actual unit could be voltage referring to the voltage on the input terminal or ms 2 if an accelerometer is connected to the input Num al keyboard The number printed on the keys are entered if you press one of the keys on the keyboard E A numeric value has been entered The i...

Page 32: ...ections and other corrections like windscreen random field etc are turned off 1214 1216 1217 Vertical vertical direction This mode is used when connecting any of the outdoor microphones Nor1214 Nor1216 or Nor1217 with the sound propagating in the vertical direction typical used when measuring air craft noise If you use a Nor1225 set the pol volt field below to ON Set it to OFF if you use a Nor1227...

Page 33: ...ment Setup menus Start a measurement Select function to be displayed Select time constant F S I Σ Global or Δ Profile domain Graphical on screen a weighting Absolute time on off Power on off Exit certain menus Cursor keys to navigate in the menus and to operate the graph cursors Causes the graph cursor to jump one screen width in either direction Memory handling Record Time or frequency domain Sel...

Page 34: ...e place before a measurement session is commenced or whenever required by applicable standards If you know the microphone cartridge sensitivity you may key this in using the numerical keypad However doing so will never replace calibration with a sound calibrator as the sensitivity adjustment procedure will be unable to reveal possible microphone preamplifier or extension cable malfunctions No need...

Page 35: ... sound calibrator you won t be able to know what level the measuring instrument is supposed to show The output level is normally printed on the sound calibrator or stated in its accompanying user documentation 4 Free field microphones require lower settings Be aware of the fact that instruments using free field microphones shall be adjusted to a value slightly lower than the output level of the so...

Page 36: ...0 mV Pa corresponds to 26 0 dB The instrument may also be set up to compensate for the attenua tion taking place in the preamplifier which normally amounts to about 0 7 dB see Preamplifier attenu ation in the Technical specifications for more on this This value is factory set and should normally not be changed unless you permanently change to a microphone cartridge with another cartridge capacity ...

Page 37: ...NTER key four times 5 By pushing the CAL key the Mic Check signal is activated The measured signal is then read in the display The level will be dependent of the actual previous sensitivity calibration as well as the individual preamplifier and microphone in use Normally using the Norsonic Preamplifier Nor1209 and Microphone Nor1225 the level will be approx 90 dB with a 1 2 dB variation from instr...

Page 38: ...ng This affects the look of the measurement duration set up menu To read more about optional extensions see The principle of the optional extensions How the menu looks with and without the optional extension 6 installed is shown overleaf Navigating in the menus Observe the following general guidelines applicable to every Nor140 menu To navigate between editable parameter fields in the menu use the...

Page 39: ...he statistical sampling takes place 10 times a second it will take 10 seconds to produce 100 samples You will need at least 100 samples to be able to calculate the 1 percentile Likewise for the 0 1 percentile the minimum time required will be 100 seconds Measurements whose duration are shorter than these minimum limits will not produce percentile values for all possible settings of the percentiles...

Page 40: ...e LMIN functions Leq LPEAK and LE do not make use of time constants Units configured for German speaking markets will also measure the LeqI The presence of multiple time constants eliminates the need for setup of the time constant Multiple time constants and statistics Observe that the statistics buffers optional extension will be based on sampling using time constant F This cannot be changed by t...

Page 41: ...ing measurement Press the STOP key To resume a terminated measurement To resume a terminated measurement press the PAUSE CONT key Upon resuming the instrument will go on measuring until the total measurement time elapsed equals the preset duration When a terminated measurement is resumed the back erase feature see below will not be activated To switch between absolute and relative time To switch b...

Page 42: ...ain This function is particularly useful to exclude undesirable noise events The Back erase time can be set to any value between 0 and 20 seconds Press SETUP 1 9 8 to access the menu When you press the PAUSE CONT key during an ongoing measurement the instrument will temporar ily halt the measurement until the PAUS CONT key is pressed again Dependant on the set back erase time the last acquired dat...

Page 43: ... return to READY mode i e how the instrument behaved before the measurement was started press the EXIT key You will be prompted to store the data or press EXIT again In both cases the instrument will go back to READY mode The SPL will now be displayed again If you choose not to store the data i e you did press EXIT a second time the measured data will be lost beyond retrieval Storing is dealt with...

Page 44: ...ing the percentiles Instruments equipped with the optional extension 4 statistics will measure the statistics every time This cannot be switched off The sampling for the statistical calculations is made with F time constant and the class width is 0 2 dB over the entire 130 dB dynamic range always You may think that storing all these data will require a huge memory and you re absolutely right There...

Page 45: ...ith the statistical exten sion will exit the table upon the second push on TBL and return to the sound level meter display mode The sequence is shown in the side bar Storing the acquired data The Nor140 has a large non volatile memory to hold the measurements The memory structure resembles the memory structure of a personal computer in the sense that both use folders and files In addition data may...

Page 46: ...INC DEC key to select param eters on off Use arrow keys to move to the desired field Use NETW key to move between A C or Z and Ln table values The table is accessible using the TBL button if you are in the graphical Sound Level Me ter display Not L t or L f display Please note that all the other standard tables accessible from the graphi cal sound level meter display are replaced by the user defin...

Page 47: ...file logg ing This affects the look of the Measurement duration setup menu To read more about optional extensions see The principle of the optional extensions How the menu looks with and without the optional extension 6 installed is shown below To produce the measurement duration setup menu Press SETUP 2 To leave the menu press the ENTER key Instruments without the multispectrum extension op tion ...

Page 48: ... your instrument is not equipped with the optional extension 5 parallel time constants see Units equipped with multiple time constants you may want to specify the time constant to be used in the measurement The time constant is used for the SPL the LMAX and the LMIN measurements but neither Leq nor LE make use of it To set the time constant press the TC key until the required time constant appears...

Page 49: ...our application For such cases there is a special function available Here you can specify the upper and lower frequency of interest and the calculated Leq value for this frequency range will be displayed in the tabular result picture as L eq Activating the frequency mode In order to enable frequency analysis the frequency mode must be activated Turn on the instrument or select MODE 1 to make sure ...

Page 50: ...ivated To switch between absolute and relative time To switch between time elapsed since start of measurement relative time and date time of day absolute time use the ABS t key Switching to displaying the spectrum Having activated the frequency mode and left the menu just press the f t key to display the level vs frequency and press again to return to the other display Since no measurement has bee...

Page 51: ... preset duration The measurement has now ended successfully as opposed to if you press the stop key to forcefully terminate an ongoing measurement If you now press the PAUSE CONT key the instrument will resume the measurement and go on measuring for another 5 minutes so that the total meas urement time assumes 10 minutes i e twice the initial setting If you do this again the total measurement time...

Page 52: ...nal extension 0 However since the frequency analysis is made in parallel with the traditional A and C or Z weighted sound level measurement the broadband peak levels and the TMax5 levels are still assessed during the measurement No SPL after the measurement During measurements the SPL value is updated eve ry second Once the measurement is over the SPL becomes meaningless A single SPL value cannot ...

Page 53: ...constants Units equipped with multiple time constants will measure SPL LMAX and LMIN with all three time constants F S I employed simultaneously In sound level meter display mode use the FUNC key to produce the function and then TC key to display values with the different time constants In the frequency spectrum display mode the functions will appear in the following sequence SPL Leq LMAXF LE LEQI...

Page 54: ...atistics is optional Units not configured for the German speaking markets will have tables without I Leq LeqI and Tmx5 values To switch between A and C or Z weighted values use the NETW key Use the FUNC key to select function Use the vertical cursor keys to scroll the centre frequency up and down Use the vertical cursor keys to change the fre quency band 2 1 TBL 1 TBL ...

Page 55: ... band They cannot have individual settings Missing percentiles There may be per centiles that fail to produce values in the table This is because you have not meas ured for a time long enough to provide the necessary number of samples Statistical sampling which should not be con fused with the sampling of the analogue to digital conversion takes place 10 times a second For comparison the sampling ...

Page 56: ...a requires that the instrument is equipped with the 1 1 octave option The rating is also calculated if the measurement is performed with 1 3 octave spectra In this case the Nor140 is automatically recalculating the 1 3 octave values to 1 1 values prior to the noise rating calculation Noise Criterion NC were established in U S for rating indoor noise and noise from air conditioning equipment etc In...

Page 57: ... frequency rumble MF for mid frequency roar and HF for high frequency hiss There is also two subcategories of the low frequency descriptor The LFb denoting a moderate but perceptible degree of sound induced ceiling wall vibration and the LFa denoting a notice able degree of sound induced vibration The rating value NC NR and RC Mark II is obtained by plotting the octave band levels for a given nois...

Page 58: ...t and the fre quency analysis both consider the entire measurement as a whole without dividing it into smaller parts One may therefore consider these two measurements as global measurements while the level vs time meas urements represent the profile In the display the global measurements are denoted Σ pronounced sigma while the profile measurements are denoted Δ pronounced delta To switch between ...

Page 59: ...ment Selected resolution No of periods with selected duration and resolution Max No of periods depends on the amount of free memory available The Δ indicates profile global is indicated by a Σ Graph cursor Use keys to move the cursor along the graph This feature is not available during a meas urement Display top scale Spectral weight ing function applied to the right hand bargraph Measurement runn...

Page 60: ...ing markets will have tables without I Leq LeqI and Tmx5 values To move the graph cursor use the keys but not during a measurement only after Use keys to move to another frequency spectral weighting network To scroll through the table use the keys but only after a measurement Use FUNC to display another function 6 1 TBL 1 TBL To switch between A and C or Z weighted values use the NETW key ...

Page 61: ...son why we designed it this way was to provide you with the complete overview if you later transfer the acquired data to your PC you will be able to do calculations on any parts of the profile while at the same time you ll be able to see the intervals that didn t take part in the global assessments Consequently the duration of the measurement will seem ambiguous The global duration will be less th...

Page 62: ... weighted and Z or C weighted levels To start the time profile measurement Press START To switch to see the time profile Press the Σ Δ key To return to global mode press the key again The features available while measuring described in the chapters Simple sound measurements and Frequency analysis apply even here Presenting the L t as a table Numerical presentation of the acquired data works even h...

Page 63: ...erm we call Moving Leq In the Nor140 we have added this to the other measurement parameters so it is done in parallel We also extended this to include 2 separate user defined periods with each having their separate threshold levels which means you can follow 2 separate events simultaneously To set up the parameters go to the setup and select the function You are then prompted to key in the duratio...

Page 64: ...r the moving windows with the set duration while the measurement is running in the above example 10 seconds and 20 seconds respec tively Please note that these values are not stored as they only represent the momentary values Instead it is the MLeqMax1 and MLeqMax2 that gives you the maximum value ie the period with the highest Leq In addition you also have total duration the noise level was above...

Page 65: ...47 Norsonic Nor140 Instruction Manual Using NorXfer the Moving Leq values are reported as follows in the Global sheet ...

Page 66: ...n the overview and keeps the amount of memory spent low Although it may be tempting to measure everything do not forget that you are go ing to review the acquired data afterwards How much time are you willing to devote to that Setting up the functions to log 1 To gain access to the profile function activation menu press SETUP 3 L t par This menu looks as shown to the right 2 Navigate in the menu a...

Page 67: ... to just print a few of the functions measured However for convenience we offer the feature of setting up the same functions for printing as for measurement If you then want to print fewer functions just go to the print functions setup menu and deactivate those you won t need To produce the print functions setup menu Press SETUP 1 9 1 Functions to be printed are denoted by a 1 The same applies to ...

Page 68: ...on of the measurement will seem ambiguous The global duration will be less the pause and less any back erase while the profile will have a duration including the pause length and without back erase The effect of pressing stop before resuming If you terminate an ongoing measurement prematurely by pressing the STOP key and later resume the measure ment by pressing PAUSE CONT an S marker will be adde...

Page 69: ...ibed in the chapters Simple sound measurements and Frequency analysis apply even here Displaying the functions measured To see the different functions measured just use the FUNC key as usual Presenting the L t as a table Numerical presentation of the acquired data works even here Press TBL while in Δ profile mode to produce the table This can be done during as well as after a measurement Use keys ...

Page 70: ...the graph If you move the time cursor onto such a dot the marker type i e its number will appear in the display During a measurement adding any of the markers 1 2 and 3 will assign the corresponding marker number to the current period only When you press marker number 4 however the marker will stay on until the key is pressed again The marker will therefore be assigned to the current period plus a...

Page 71: ...recorded signals and hence inserted R markers for one measurement is limited to 1000 In addition each measurement may contain up to a total of 1 000 markers of all the other kinds In these limitations each toggle marker only counts as one marker Instrument markers have priority The marker 4 is a toggle marker i e once activated it will assign a marker to every period occurring until it is deactiva...

Page 72: ...um Multispectrum measurements can be made based on basic as well as enhanced time profile extensions installed Instruments equipped with basic profile extension Units equipped with basic time profile extension and filters of course have a very simple setup procedure To set up for multispectrum measurements basic time profile 1 Set up the instrument to make time profile measure ments as described i...

Page 73: ...king multispectrum measurements Multispectrum measurements are made in the same way as ordinary time profile measurements The only difference lies in the fact that the multispectrum meas urements log the spectrum as a function of time and not just the broadband values To go between level vs time and level vs frequency 1 Make sure the instrument is in profile mode a Δ dis played in the upper left c...

Page 74: ...other domain than the one displayed to move in time when displaying the spectrum and to move in fre quency when displaying a time profile To move the cursor along the time profile axis 1 Make sure the display shows the time profile level vs time If needed use the f t key 2 Use the and the keys to move the cursor along the time axis 3 Use the and the keys to move the cursor one screenwidth along th...

Page 75: ...ot press the Σ Δ key to enter global mode 2 Use the f t key to go between the sound level meter display and the spectrum display Move the spectrum cursor as explained above The spectrum you see now is the global spectrum This spectrum should not be confused with the multispec trum feature The result tables The measured values can be presented tabulated as usual In multispectrum mode there are two ...

Page 76: ... 10 Multispectrum measurements Global mode Global frequency mode Multispectrum mode Profile mode Optional requires statistics 6 6 1 TBL 1 TBL 1 TBL 1 TBL 1 TBL 1 TBL 1 TBL 1 TBL 1 TBL 1 TBL 1 TBL 1 TBL 1 TBL 2 2 ...

Page 77: ... even start a measurement from within any of the tables All functions available for a profile measure ment apply even here If your instrument supports the use of markers they may be used in the usual way Pause and global back erasure also works as usu al For a discussion of these features turn to Enhanced time profile measurements Basic time profile meas urements and Adding markers to a measuremen...

Page 78: ...used independent of the setting in the instrument Selecting Engineering Units The selection between levels in decibel or linear units in EU is selected in the instrument set up menu Press SETUP and select 1 Instr 9 Misc par 6 Units Use the field cursor to highlight dB or EU as appropriate and press ENTER repeatedly until you are back in the ordinary display How values are indicated Due to the high...

Page 79: ...re levels 20 μPa A linear quantity X will therefore correspond to a level where This implies that 1 EU corresponds to 93 979 dB or as usually stated 94 dB Calibration The sensitivity is always expressed as a logarithmic sensitive in dB relative to 1 volt EU Even if engineering units are selected the sensitivity still has to be speci fied in this way However if a calibration signal is pre sented to...

Page 80: ...vity of 50 mV Pa or 0 05 V Pa The SI unit pascal Pa is now used as EU The logarithmic sensitivity will be If you set the sensitivity to this value and dB is select ed the sound pressure will be indicated in dB relative to 20 μPa If EU is selected the signal will be indicated in pascal Normal levels will correspond to the root mean square value RMS but the peak value will cor respond to the absolut...

Page 81: ...ilable for storage has the name of today s date and the files are numbered consecutively in ascending order as they are stored starting at 0001 Internal memory size The available internal memory for storing of measure ments is approximately 25 megabytes This is a num ber which says more or less nothing to most people since it reveals nothing of the number of bytes required to store the measured va...

Page 82: ...e for storing You may select either the internal memory or the op tional SD card as the location for storing data You have one selection for measurement setups and one for the result of the measurements The selection is done in the instrument menu Press SETUP 1 Instrum 1 Storing Use the cursor key and move to the field for setup Use the INC or DEC key to select the wanted place for storing the set...

Page 83: ...tion Microphone sensitivity calibration Preamplifier Polarisation voltage Calendar clock settings Serial interface on off and baud rate or USB selection Second weighting network C or Z weighting Level range Normal High Units dB or engineering units Corrections on off Printer Language for print Instrument identification Option 11 This is setup No 4 stored in this instrument S for stored If you have...

Page 84: ... be created by the instrument The first file gets the number 0001 the next gets the number 0002 etc If you choose to delete one of the files already stored you will leave a gap in the file list This gap will not be filled with a file stored later but be left open Otherwise you will easily loose track of which file contains what When a measurement is stored a genuine identity number instrument ID i...

Page 85: ...elected folder press the key and locate the file in question by means of the vertical cursor keys Press ENTER to recall the located file setup or EXIT to leave the menu without recall ing any file setup Retrieving stored setups and data Storing device Standard set up Some standard set ups are delivered with the instru ment You may use one of these set ups as a start ing point for making your own v...

Page 86: ...ments 0003F Simple frequency analysis with 1 1 octave resolution 0004F Simple frequency analysis with 1 3 octave resolution 0005M Multi spectre frequency analysis with 1 1 octave resolution 0006M Multi spectre frequency analysis with 1 3 octave resolution 0007R Reverberation time measurements in 1 1 octaves with noise excitation 0008R Reverberation time measurements in 1 3 octaves with noise excit...

Page 87: ...d to confirm your action However as default the cursor is positioned on the cancel field to avoid erasing the wrong file 2 Use the cursor keys to move the cursor to cur file and press ENTER again The file is now deleted Clearing folders or the entire memory To clear a folder Press DEL Select it using the cursor keys and press ENTER You will now be prompted to select between clearing the CUR DIR i ...

Page 88: ... means a multispectrum measurement P means a measurement made in sound power mode R means a reverberation time measurement T means a profile measurement with or without a frequency analysis may also appear for a reverb time measurement B means Building Acoustic measurement means a STIPA measurement f means a FFT analysis A means an Audiometer mode measurement I means an Impulse response measuremen...

Page 89: ...od of the same dura tion and then store the acquired data start again and so on The snag however is that a little time will always be spent on storing the acquired data This means that if you for example set up the instrument to measure in periods of an hour and start the measurement exactly on the hour the measurement period start time will ex hibit a lag after some hours of measuring typically 3...

Page 90: ...c A similar situation when the measurement period is set to 15 minutes will be The first period is as before 7 minutes and 20 seconds The following periods are all shortened so the sum of the time for measurement and storing are kept within the limit of 15 minutes The instru ment will start a new measurement period a couple of seconds after the following hour 09 00 09 15 09 30 09 45 10 00 10 15 et...

Page 91: ...will you need and how detailed should it be Measurement period length Profile resolution required if applicable The need for frequency analysis and bandwidth if applicable The functions to be measured The need for statistics if applicable The type of outdoor microphone unit for semi permanent or permanent installations Type of calibration and microphone check Adaptors needed if applicable Cabinet ...

Page 92: ...ber of characters that fit on a page Therefore we recommend that you make a few ex periments with the setup and your printer to find the driver that produces the best looking printouts Norsonic may provide a suitable cable between the instrument and the printer Setting up for printouts The setup for printouts is made in the IO Print menu To set up for printing 1 Press SETUP 1 Instr 2 IO Print 2 Se...

Page 93: ...rument will prompt you to decide whether this setup shall be copied to the Prnt par menu as well for convenience Note that this applies to profile printouts only To start a printout 1 Set up everything as required 2 Press the PRINT key For level and frequency analysis measurements the entire data set will be printed out For profile measure ments the printout will contain the periods from the prese...

Page 94: ...table for Windows The data can be delivered as a text file or as an Excel workbook Included with the instrument is also a PC program Virtual Instrument which allows you to operate the sound level meter Nor140 from the PC and display a copy of the information on the instrument screen on the screen for the PC Combined with a PC projector this is ideal for demonstration and training The connection to...

Page 95: ...ble Nor4525 included and a suitable USB driver down load from www norsonic com release A recommended way to transfer data to a PC is by means of the software program NorXfer Nor1020 The programs NorXfer and NorVirtual Instrument can be downloaded from www norsonic com release We propose that you first install NorXfer and later the NorVirtual Instrument When you select to use USB the PC will look f...

Page 96: ...and Win 8 x compatible When the driver installation starts the following dialog window will appear NorXfer normally doesn t need any codes to run unless opt 1 or 2 are in stalled NOTE If this installation is an update of an existing version of NorXfer the old version must be removed before you proceed with the installation itself Ob serve that files stored in My Measurements are left unaffected by...

Page 97: ...have plugged in the Nor13x Nor14x for the first time it may take some time less than a minute before Windows activates the driver After you have plugged in the Nor13x Nor14x you may check if the driver is working properly by starting Device Manager and checking the Ports section Here you will also see which COM port is assigned to the attached device ...

Page 98: ...t The menu below appears Select either local SD card Nor140 or the appropriate USB port Nor13x and Nor140 dependent on where the data is stored The instrument will appear as shown below Double click on the instrument in the right frame to expand the file folder Mark the measurement files that you want to copy onto the PC Use drag and drop to the My measurements folder or right click and select sen...

Page 99: ...81 Norsonic Nor140 Instruction Manual An Excel file is generated that contains all the meas ured values Measurements in rows values in columns ...

Page 100: ... Download the program from www norsonic com release Follow the procedure given by the installation program Using Virtual Instrument Nor1036 Connect the instrument to the PC and select the se rial or the USB interface as appropriate by pressing SETUP 1 2 Start the program Virtual instrument Nor1036 The program will automatically start to look for the instru ment This may take some time The screen b...

Page 101: ...applications as for measuring the AC voltage from other transducers or sources The measurement range is from 10 volt peak to levels less than a microvolt dependent of the applied frequency weighting The cable Nor1438 with a BNC connector in the far end may be convenient for such applications In this case you should set the input from STANDARD to LINE IEPE The input terminal pin 4 may also supply c...

Page 102: ...nal You may use the terminal for listening to the measured signal or you may use it for other purposes The signal output gain is set via the selection of dis played full scale Full scale on the display corresponds to 100 mV on the signal out terminal Although the se lection of full scale will not affect the measurement it will determine the sensitivity for the signal out Use the INC and DEC keys t...

Page 103: ...e is se lected so the measurement is terminated before a new trigger condition is satisfied The measurement may also be initialised by a trig ger signal from an external device When started the measurement will last as long as set up by the meas urement duration parameter By using the storing op tion Repeat a new measurement may be started by a new trigger signal after the first is finished The ex...

Page 104: ...ving the menus For making a measurement press the START key A Wait indicator will be shown in the display instead of the Run indica tor When the displayed time of the day as indicat ed by the clock in the instrument coincides with the triggering time a measurement will be automatically started If you want to interrupt a waiting for trigger opera tion press the STOP key If you set the repeat measur...

Page 105: ... you set the repeat measurement function Press SETUP 1 1 the instrument will start a new meas urement after the first is finished and wait for the trigger condition to be satisfied again If you want to interrupt a waiting for trigger opera tion press the STOP key Level above trigger The level above trigger function allows a measure ment to be started as soon as the level in the specified network o...

Page 106: ... If you set the repeat measurement function Press SETUP 1 1 the instrument will start a new meas urement after the first is finished and wait for the trigger condition to be satisfied again If you want to interrupt a waiting for trigger opera tion press the STOP key ...

Page 107: ...ignal is request ed When the sampling frequency is set to 12 kHz only frequencies up to 5 kHz can be reproduced However in most cases this is sufficient for noise source iden tification Note that the best format consumes twelve times as much memory as the simplest for storing a recording with a certain duration Recording gain The Nor140 has a large dynamic range exceeding 120 dB This means that if...

Page 108: ...condition was fulfilled The recording file is automatically assigned to the cur rent measurement When the level versus time display is selected the time for the recording will be marked adjacent to the time axes See figure below The audio file itself can not be seen in the Recall function picture You can use the program NorXfer to transfer the files to your PC for further examination or analysis M...

Page 109: ... 99 seconds before RECORD was pressed Note that a measurement has to be running before you are allowed to store a record Key in the value or use INC or DEC to modify the dis played value External trigger Set External to ON by the use of the INC or DEC keys if you want to enable triggering by an external signal to the digital input terminal After pressing the START key the instrument will start wai...

Page 110: ... to transfer the file to a PC This may be done by transferring the measurement data with the recording to a PC or by storing on the SD card and plugging the card in a card reader In both cases we recommend to use the program NorXfer Nor1020 for taking care of the menu struc ture When the result is analysed with the PC program NorReview Nor1026 the measurement and the sound recordings are automatic...

Page 111: ...e Ref tone menu The menu is displayed by pushing SETUP 1 Instr 8 Ref tone The reference tone feature is enabled by using the cursor keys to move the cursor to the upper position and selecting ON using the INC or DEC keys The preset type gain and excitation time of the reference tone are edited in the same menu The type is either PINK noise or a SINE wave If the SINE is selected the actual frequenc...

Page 112: ...rement is that the Freq Mode is turned On in the upper part of the menu In the Ref curve menu either the Upper or the Low er or both must be turned On These selection will turn on the currently stored upper and or lower Reference Spectra in the graphical level vs frequency display This menu is opened by first moving the field cur sor into the lower part of the Freq Mode menu and then using the 1 k...

Page 113: ...TER key the stored Leq values from the selected spectrum will be entered as the new Reference Spectrum In case a measured 1 3 octave spectrum is chosen as a Reference Spectrum for a 1 1 octave comparison the 1 3 octave spectrum will be re calculated into a 1 1 octave spectrum automatically Choosing a previ ously measured 1 1 octave spectrum for a 1 3 octave comparison will produce an error message...

Page 114: ...s are made On The Go NoGo comparisons functions con tinuously before during and after the measure ment When selected On a sub menu appears where you may select a Delay This delay will hold the Go NoGo comparison signal on the digital I O active the number of second that is entered Any value between 0 and 99 seconds is accepted This feature is especially useful when an alarm lamp or other type of w...

Page 115: ...pectra is above the upper reference spec tra or below the lower Reference Spectra If only one of the Reference Spectra is activated only this spectrum is considered for the digital output status See setup of digital I O A digital output line of the I O socket may be set to go high when the instrument is busy taking a new measurement i e in Running or Ended Stopped and until the instrument is ready...

Page 116: ...the adjacent figure will be shown Use the arrow buttons below the display to move the field cursor Use the INC and DEC key to change the content The gain may be entered as a numeric value Press ENTER to terminate a key in operation Gen switches the signal generator on off If Sync is on and Gen is off the signal will be switched on when a measurement starts and be switched off after the measurement...

Page 117: ...tments for reverberation measurement When the instrument is equipped with option for measuring reverberation time Option 9 the noise generator may be used for the excitation The setup is done in the Reverberation control menu as shown on the figure The excitation type Ex type may be selected impulse IMP or noise NOS The Excitation time Ex time indicates number of seconds for the noise excitation F...

Page 118: ...tion and correction Instrument menu General Sometimes the accuracy of a measurement can be increased if the measurement is corrected or compen sated for other known effects Nor140 has the ability to make corrections related to Use of windscreen Measurement of random incidence sound or diffuse sound fields Measurement of low levels Option 18 Use of windscreen A microphone windscreen is a useful dev...

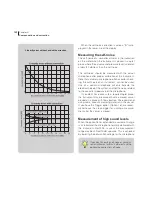
Page 119: ... to deactivate When the random inci dence correction is applied a R is displayed in the lower line of the display Measurement of low sound levels When measuring very low levels the indicated level may be influenced by the self noise of the instrument If you measure an A weighted level of 25 dB which is about 10 dB above the typical self noise of 15 dB the contribution from the self noise will make...

Page 120: ...phone often used for check ing the self noise of an instrument cannot be used Use of a dummy microphone will only indicate the electrical noise of the system and not the noise related to the acoustic impedance of the microphone If you don t have access to a required quiet place the instrument may be placed inside a closed vessel placed on a place with low vibration We recommend using some acoustic...

Page 121: ... level meter shall indicate the usual level as stated for the calibrator also when the extended measurement range is selected Marks on the lower line of the display Marks for the applied corrections are found on the lower line of the display dB The signal strength is indicated as a level in decibel The reference level is normally 20 µPa for sound pressure levels EU Engineering unit The signal stre...

Page 122: ... reverberation time Assume that you switch on a sound source in a room equipped with a microphone system You will note that the sound level will not reach a steady level immediate ly The reason why is that the sound will consist of the direct sound radiating from the source in combination with reflected sound and these reflections take time before they reach the microphone If you now switch off th...

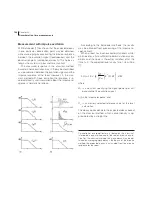
Page 123: ...easuring the reverberation time by using interrupted noise is often referred to as the classical method The noise source is switched on for a time sufficient to ob tain a steady level The source is thereafter switched off and the decay of the sound in the room is ob served Without loss of generality the time for switch ing the noise off may be set to t 0 A plot of the sound pressure level versus t...

Page 124: ...the results may be obtained from processing of the impulse re sponse itself When a room has been excited by stationary white pink noise for a time sufficient to obtain stationary con ditions and the noise is thereafter switched off at the time t 0 the expected level at any time t 0 will be 1 dB d lg 10 2 ref 0 t h C W t L τ τ where W0 is a constant specifying the signal power per unit bandwidth of...

Page 125: ...he adjacent side For the classical method a the averaged decay is obtained by averaging a number of measurements For the Schroeder method b the expected decay is obtained by processing of the im pulse response h t Measurement with swept sine excitation New technology and the use of digital signal proces sors make also other types of sophisticated analyses possible The Swept Sine technique is excel...

Page 126: ...r fitting a linear decay curve which is used for the reverberation time calculation The instruments automatically compare the lowest levels for the calculation with the estimated background level and gives warnings if the distance is not sufficient Noise excitation When the reverberation time is meas ured with interrupted noise from the internal noise generator the level is logged with a time reso...

Page 127: ...r ampli fier and generator The sine sweep signal covers the frequency range from 42 2 Hz to 23 7 kHz The sweep is logarithmic and it is performed in 1 5 seconds Data acquisition takes 2 73 seconds The signal sampling rate is 48 kHz Minimum reverberation time possible The frequency analysis in the form of 1 3 and 1 1 oc tave filters sets a lower boundary for the reverberation times that can be meas...

Page 128: ...50 Hz 0 60 63 Hz 0 48 0 24 80 Hz 0 38 100 Hz 0 30 125 Hz 0 24 0 12 160 Hz 0 19 200 Hz 0 15 250 Hz 0 12 0 06 315 Hz 0 10 400 Hz 0 08 500 Hz 0 06 0 03 630 Hz 0 05 800 Hz 0 04 1 kHz 0 03 0 02 1 25 kHz 0 02 1 6 kHz 0 02 2 kHz 0 02 0 01 2 5 kHz 0 01 3 15 kHz 0 01 4 kHz 0 01 0 01 5 kHz 0 01 6 3 kHz 0 01 8 kHz 0 01 0 01 10 kHz 0 01 ...

Page 129: ...nd the appropriate filter bandwidth 1 1 or 1 3 octave See the chapter Frequency analysis for details Press the SETUP button to change the set up for the reverberation mode Make sure the excitation type is set to Impulse Press SETUP 2 and move the cursor filed to excitation type Ex type and select IMP by the use of the INC or the DEC key There are two storing options for reverberation time measurem...

Page 130: ...e settings you must terminate the ongoing measurement To terminate an ongoing measurement you have to press STOP or PAUSE CONT In both cases the instrument will return to ready condition If a measurement has been made and the result table is displayed press EXIT twice to enter this condition During the measurement the instrument will show the remaining measurement time The total measure ment time ...

Page 131: ...d the result are stored and automatically assigned a file number displayed at the top of the display The values may later be retrieved by pressing RECALL Measuring according to interrupted noise method The instrument can make use of the option 10 Noise generator or an external noise source see later in this chapter With option 10 Noise generaltor installed press MODE 2 for Reverberation Reverberat...

Page 132: ...he instruments switch on the noise for the selected excitation time and present the W mark The logging of the level starts when the noise is switched off and the run indicator R is displayed The instrument will measure for a number of seconds dependant on the maximum expected reverberation time from 5 to 40 seconds and count down to 0 to indicate how much is left of the measurement The acquired re...

Page 133: ...appropriate filter bandwidth 1 1 or 1 3 octave See the chapter Frequency analysis for details Reverberation Menu Reverberation Table Push ENTER Use SETUP 2 to set Ex type to EXT Push ENTER twice In this menu there are two storing options for rever beration time measurements The result table will al ways be stored of course But in this menu you may also turn on or off the storage of the decay curve...

Page 134: ...will be displayed instead of a value Press FUNC for displaying T20 or T30 as appropriate After the measurement you may inspect the level profile of the measured signal by pressing the key Σ Δ Note that the logging of the profile starts when you press the start button Move the cursor to scroll along the time axes You may com press the display by pressing the key The factor for compression is displa...

Page 135: ...now is in reverberation time mode Press the START key The instruments start send ing out the swept sine sequence and at the same time start the logging the response A special picture ap pears on the screen Reverberation Table Reverberation Running Once you have pressed the START key then you have to wait for this sequence to finish and it takes about one minute The calculation of the reverberation...

Page 136: ...acteristic dimension d0 is shown in the Fig on the next page One of the following two shapes shall be used for the measurement surface a a rectangular parallelepiped box whose sides are parallel to those of the reference box In this case the measurement distance d is the distance between the measurement surface and the reference box b a hemispherical surface or partial hemi spherical surface of ra...

Page 137: ... 2 2 2 3 2 2 Reference box on three reflecting planes d l l l 0 1 2 2 2 3 2 Hemispherical measurement surface The hemisphere shall be centred in the middle of the box consisting of the reference box and its images in the adjoining reflecting planes point Q in the Figs overleaf The radius r of the hemispherical measure ment surface shall be equal to or greater than twice the characteristic source d...

Page 138: ... location of four key mi crophone positions each associated with equal areas on the surface of the hemisphere of radius r If a source is installed adjacent to more than one re flecting plane the Figs shown on the next page are used to define a suitable measurement surface and the microphone positions Additional microphone positions Sound pressure level measurements are required at additional micro...

Page 139: ...s are numbered 14 15 16 and 20 4 5 15 14 6 16 20 10 6 0 Reference box Measurement surface Reference box z x 0 89r 0 45r 1r Measurement surface 16 4 5 14 15 6 10 20 One reflecting plane Two reflecting planes Three reflecting planes 45 NB Dimensions in metres 2 1 3 5 6 4 1 1 1 NB Dimensions in metres Key microphone positions Additional microphone positions ...

Page 140: ... the measurement surface Microphone positions The microphone positions lie on the measurement surface a hypothetical surface of area S enveloping the source whose sides are parallel to the sides of the reference box and spaced out a distance d measure ment distance from the box The microphone positions on the parallelepiped measurement surface are shown on the following pag es The area S of the me...

Page 141: ...determined from measurements over the com plete set of microphone positions in accordance with the procedures described above An example is when the radiation pattern is shown to be symmetrical The overhead position s may be omitted for safety reasons if so stated in the relevant noise test code Mic positions one reflecting plane Each plane of the measurement surface shall be con sidered on its ow...

Page 142: ...microphone placement for a larger machine Details on the microphone posi tioning can be found in the ISO3746 l2 d d d d l3 l1 Reference box Microphone position Microphone placement with four microphones for floor standing ap pliances placed against a wall and three microphones for floor standing appliances placed in a corner ...

Page 143: ...rce un der test For the purpose of the survey method the method described here the measurement surface is consid ered to lie outside the near field if the measurement distance from the source under test is equal to or greater than 0 15m α Description of Room 0 05 Nearly empty room smooth hard walls made con crete brick plaster or tile 0 1 Partly empty room room with smooth walls 0 15 Room with fur...

Page 144: ...ement surface The K2A factor The environmental correction factor K2A accounts for the influence of undesired sound reflections from room boundaries and or reflecting object near the source under test The magnitude of this factor depends principally on the ratio of the sound absorption area A of the test room to the area S of the measurement surface The magnitude does not depend strongly on the loc...

Page 145: ...weighted sound power level of any test object in accordance with ISO3746 and re lated Standards This means that when equipped with a Nor140 you may test the LWa of new products for the European labelling in the production area in situ rather than in a laboratory in vitro Making measurements Before you start to make sound power measurements we recommend that you familiarise yourself with how to mak...

Page 146: ...n a corner Use next and previous to go between pages After a successful set of measure ments has been made the results are presented like this upon press ing the TBL key Although only 8 microphone posi tions are shown there are further pages so that a total of 40 micro phone positions can be covered Use the key The measurement control display The results can also be printed out Turn to Making hard...

Page 147: ...by means of reverberation time measurements The value of A is then given in m2 by A α SV in which SV is the total area of the surface of the test room walls ceiling and floor in m2 Hemisphere S 2πr2 Calculating the S α Description of Room 0 05 Nearly empty room smooth hard walls made con crete brick plaster or tile 0 1 Partly empty room room with smooth walls 0 15 Room with furniture rectangular m...

Page 148: ...p menu The selected surface is indicated by H for Hemispherical and P for Parallelepiped with an additional W or Cfor test objects placed against a wall or in a corner The selected sur face is also indicated by a simple diagram 2 Depending on the selected surface the measurement radius or the distance from the reference box i e the minimum box that fits around the test object must be keyed in The ...

Page 149: ... level and the noise directivity of the test object for all microphone posi tions are found by sequential pushes of the TBL key The results may also be copied to a printer The report includes necessary spaces for all the required meas urement information to be written directly on the report by the user On a second page the individual results for each of the microphone positions are printed See Mak...

Page 150: ...rdance with the British Standards BS ISO 140 or the U S Standards ASTM E336 and E1007 Measurement of service equipment in buildings in accordance with the survey method ISO 10052 or engineering method ISO 16032 is also possible with the version 4 firmware of the Nor140 Additionally there are possibilities for measurement of the airborne and impact sound insulation in accord ance with the French re...

Page 151: ... Sound Insulation calculations Facade for Facade Sound Insulation calculations just for simplicity Service Equipment for measurement of technical instalations in the buildings For measurement of facades use Airborne as described in sections covering Facade insulation At any stage except in the results display the instrument may be brought back to normal operation by pressing MODE again and select ...

Page 152: ...ifted it in accordance with the method specified in ISO 717 1 or ISO 717 2 as appropriate The spectral adaptation terms C and Ctr are also calculated according to the same standards Temperature correction on the speed of sound When calculating the airborne normalized difference Dn or the impact normalized level Ln in accordance to the American ASTM Standards the temperature influ ence on the speed...

Page 153: ...ng to the ISO 10052 standard are made in octave bands Option 1 Octave frequency analysis is therefore required in addition to Option 11 The procedure described in the Internation al standard specifies how to measure sound insulation by measuring levels in octave bands and estimating the acoustic absorption reverberation time Service equipment sound is measured in the normal mode of operation Engin...

Page 154: ... the spatial average of the sound level in the room is required For survey meas urements this may be achieved by measuring the lev el while moving the sound level meter microphone around in a figure of eight trajectory Recommended measuring time is 30 seconds For the engineering method point by point measurements has to be applied and the instrument will calculate the averaged level The level meas...

Page 155: ... results The acoustic losses of the receiving room used in the calculation may be obtained by measurement by recalling measured value or by estimation The instrument must be equipped with the option for re verberation time measurements in order to allow the measurement option to be used If the optional noise generator is installed it may be used for the excitation Calculator screens Estimating the...

Page 156: ...rdised level difference DnT The apparent sound reduction index R The source room level L1 The receiver room level L2 The reverberation index k The reverberation time T For the values Dn DnT and R a frequency weighted value according to ISO 717 1 is also calculated together the correction terms C125 2000 marked as C and Ctr 125 2000 marked as Ctr Pressing the FUNC key repeatedly will display the di...

Page 157: ...lations This corre sponds to a reverberation index k that always is in the range 1 to 6 dB Calculating the Airborne sound insulation according to the Engineering method After selecting the Building acoustic mode select 3 Airborne Enter the value for the room volume V and press ENTER or move the field cursor to C and press ENTER for a calculator The calculator allows you to enter the length width a...

Page 158: ...nded Yes No Background noise Also the average background noise level Lb can be measured Entering values for the background noise level is optional If the level in the receiving room is more than 10 dB above the level of the background noise no corrections will be made and the final result will be independent of having measured a background level or not However if the difference between the av erag...

Page 159: ... room used in the calculation may be obtained by measuring the rever beration time or by recalling earlier measured values See the paragraph describing measurement of rever beration time If the optional noise generator is installed it may be used for the excitation otherwise impulse method has to be used To start a measurement press START when the field cursor is in the field for rever beration ti...

Page 160: ...be placed in the field for cal culation of the final result If you are satisfied with the entered values press ENTER or if you want to make any correction move the field cursor to the required field and enter the corrected values or press DEL to clear averaged values When you move the field cursor to the field Results and press ENTER the following functions are calculated for each of the one third...

Page 161: ... values are all rounded to the near est dB If you want to go back to the calculation menu just press ENTER Press the MODE button if you want to return to normal mode of operation Alternative national standards As alternatives to the default ISO 16283 1 ISO 717 1 Standards the Nor140 firmware version 4 offer two alternative national Standards for the calculation of the airborne sound insulation Thi...

Page 162: ...s the measured differences from multiple loudspeaker posi tions measurements should be averaged This may be obtained in the following way Measure the level in the source and receiving room L1 and L2 and store the result Move the cursor to the RESULT field and press DEL Then confirm that all averaged values shall be deleted Repeat the meas urements of levels in the source and receiving room as many...

Page 163: ... level more than 6 dB between adjacent one third octave bands See ISO 10140 4 and for equivalent alternatives also ISO 18233 For this reason it is a possibility to insert a software spec trum shaper in the signal path of the noise generator This equalizer can attenuate each 1 3 octave band level up to 12 dB This equaliser is made to follow the above mentioned requirements If the level difference i...

Page 164: ...ts has to be applied and the instrument will calculate the averaged level The level may be measured in the normal mode of operation and the results stored for later processing Alternatively the measurement may be started from the calculation menu when the result is required for the calculation Press SETUP to enter the menu for setting the measurement time Reverberation time For a survey measuremen...

Page 165: ...d and enter the corrected values When you move the field cursor to the field Calc result and press ENTER the following functions are calculated for each of the octaves bands 125 Hz to 2000 Hz The normalised impact sound pressure level Ln The standardised impact sound pressure level LnT The receiver room level L The reverberation index k The reverberation time T For the values Ln and LnT a frequenc...

Page 166: ... to enter the length width and height of the room in order to calculate the volume The field cursor automatically moves between the fields as values are entered If you want to adjust any previously entered value use the arrow keys to move the field cursor to the wanted parameter Receiving Room Level The next set of values to be entered is the sound levels in the receiver room L for each one third ...

Page 167: ...start a measure ment press START when the field cursor is in the field for reverberation time marked T After the measure ment you may inspect the resulting reverberation table by pressing the TBL key Display of results When the required information has been entered the cursor will automatically be placed in the field for cal culation of the final result If you are satisfied with the entered values...

Page 168: ...rall building acoustic file This features is selected if the storage mode is set to AUTO in the SETUP menu Averaging levels from multiple tapping machine positions When you measure the impact levels in many micro phone positions as described and make the average of the results the levels in the receiving room are aver aged to obtain the mean value for the tapping machine position in use However th...

Page 169: ...or reverber ation may be stored individually for later re use by the RECALL feature This is particularly useful for re use of reverberation time measurements for both airborne and impact insulation using the same receiving room Facade insulation General The facade insulation may be measured using the modes for airborne sound insulation the outdoor will then act as the source room See ISO10052 and ...

Page 170: ...le deviations between the octave band re sults and the reference curve is as large as possible but not more than 10 dB for octave bands or 32 dB for one third octave bands Noise excitation The applied method requires broadband noise to be used for the excitation The noise may be generated by the instrument if option 10 Noise generator is in stalled Sometimes it will be convenient not to have a cab...

Page 171: ...lation between rooms for further information Estimating the correction for the acoustic absorption Measurement of reverberation time See measurement of airborne sound insulation be tween rooms for further information Calculating the result See measurement of airborne sound insulation be tween rooms for further information about calculating the results Service equipment sound pressure levels These ...

Page 172: ... hardest surfaces The distance to the walls should preferably be 0 5 metre Press START for start ing a measurement or recall a measurement by using the RECALL key If measured the values are automati cally stored You are prompted to accept the recalled or meas ured values as a part of the averaged result Press ENTER alternatively STORE to accept or EXIT al ternatively DEL if you don t want to accep...

Page 173: ...e equipment normalised sound pres sure levels Leq nT LSmax nT and LFmax nT The service equipment standardised sound pres sure levels Leq n LSmax n and LFmax n The averaged corner level Lc The averaged reverberant field level Lr The averaged reverberation time T The averaged Lc plus Lr sound pressure level L The calculated reverberation index k Use the FUNCkey to scroll through the above mentioned ...

Page 174: ...en accepted for the averaging is displayed by a number N Press the TBL key to display the averaged levels Reverberation time The final set of values to be entered is the reverbera tion times The acoustic losses of the receiving room used in the calculation may be obtained by measur ing the reverberation time or by recalling earlier meas ured values See the earlier paragraph under airborne sound in...

Page 175: ...averaged reverberation time T The averaged Lc plus Lr sound pressure level L The calculated reverberation index k Use the FUNC key to scroll through the above mentioned function in order to display the desired values If you want to go back to the menu for calculation press ENTER Press the MODE button if you want to return to nor mal mode of operation ...

Page 176: ...on with the other required op tions includes all required remote commands for mak ing building acoustic level or reverberation time meas urements with the external CtrlBuild package Option 11 also extends the internal noise generator option 10 to include band pass filtered noise in addition to white and pink noise Further description of this option is given in the instructions for the CtrlBuild pa...

Page 177: ...e normal operation of the NorBuild soft ware package Sweep duration is used for selecting the speed of the sinus sweep used in the measurement This can be set to Short Medium or Long which makes the duration lasting approx 1 5 or 11 minutes respectively The longer duration the better S N ratio is achieved Required S N ratio is setting the acceptance ratio for the measured results Should any freque...

Page 178: ...ifferent listening spaces under similar conditions or assessing a speech communication channel Development of STI The basis for the STI index is that the intelligibility of speech is largely based on the slow modulation of the strength of the sound pressure signal that acts as a carrier For the full STI method the carrier is a station ary gaussian noise signal divided in seven bands in octave step...

Page 179: ... masking and the threshold of hearing into considera tion indicated the following relationship As seen from this formula a limited signal to noise ratio reduces the modulation transfer function for all frequencies A long reverberation time reduces the modulation most for the highest modulation frequen cies The STI value is a weighted average of the differ ent modulation indexes The last revision o...

Page 180: ...well as level dependent masking Calibration of the sound level meter is therefore important The STI value will be lower for speech levels below 50 dB and above 80 dB How is STIPA measured The instrument option comes complete with an excitation signal matched to the program option The excitation is played continuously through a loud speaker acting as a talker For a STI measurement all carrier frequ...

Page 181: ...onal option to be installed in the sound level meter Option 1 1 1 octave real time filters in the frequen cy range 8 16 000Hz Excitation file a zipped file Please download the audiofile from www norsonic com release Included with the STIPA option contains two tracks Track 1 and 2 Track 1 1 kHz sinusoidal signal Duration 2 minutes Track 2 STIPA excitation signal male speech Duration 70 minutes Both...

Page 182: ...r male speech signal of A weighted level Lx 125 Hz 250 Hz 500 Hz 1 kHz 2 kHz 4 kHz 8 kHz Lx 2 9dB Lx 2 9dB Lx 0 8dB Lx 6 8dB Lx 12 8dB Lx 18 8dB Lx 24 8dB Octave band levels for male speech signal of A weighted level 66 dB 125 Hz 250 Hz 500 Hz 1 kHz 2 kHz 4 kHz 8 kHz 68 9 dB 68 9 dB 65 2 dB 59 2 dB 53 2 dB 47 2 dB 41 2 dB If you play the file from a PC ensure that signal processing features like v...

Page 183: ...th A sound source according to this specification is available from different manufacturers with a typical example being the GRAS 44AA When speech is relayed through a sound system a simulator is not normally required unless a close talking or noise cancelling microphone is involved Loudspeaker or electrical excitation Most applications require that the excitation is performed using a small loudsp...

Page 184: ... modes of operation for the sound level meter By selecting this mode the instrument will automatically be configured for STI measurements For selection press MODE after switching the instrument on and select STI by pres sing the numeric button 5 After the selection the instrument is ready for a STI measurement A sign in the upper left corner of the display indicates the STI mode of operation The i...

Page 185: ...ing to IEC 60849 is also indicated The mean A weighted speech level is indicated in dB relative to 20μPa If the measured value is detected as unreliable a question mark is placed behind the indicated value for STI and CIS The speech level for each octave may be displayed by pressing TBL A second press on the TBL button displays the modulation indexes for each of the STIPA octaves NOTE We recommend...

Page 186: ...ng in the levels for the background noise is to use values from a previously stored meas urement The measured levels must have been made in 1 1 or 1 3 octave bands Press RECALL while the table for the background noise is displayed Select the requested file from stored results and press ENTER to read in the data Values measured in 1 3 octave bands are recalculated to 1 1 octave values When stored a...

Page 187: ...on Typically the value of the standard deviation is about 0 03 with stationary noise interference With fluctuating noise for example a babble of voices higher stand ard deviations may be found possibly with a systemat ic error This can be checked by carrying out a meas urement in the absence of the excitation signal This should result in a residual STI value less than 0 20 An estimate of the stand...

Page 188: ...ng the USB or serial inter face on the instrument A transfer program like NorXfer may be used STI Calc In the zipped file with STIPA calc you will also find a program called STI calc This program may be used to estimate the STI value based on information on the octave band levels for speech and background noise and the reverberation of the room also in octave bands The applied formulas assume line...

Page 189: ...and select 1 for Normal Making a measurement A measurement in FFT mode may be started as a nor mal level measurement by pressing the START button If Option 16 extended trigger is installed the same trigger possibilities apply as in normal mode of opera The FFT mode is selected in the mode menu tion the measurement may be started at a certain time of the day or if the level goes above a certain lev...

Page 190: ...d moves the cursor to the extreme left hand or right hand position respectively A further operation of these keys will scroll the display along the frequency axis The displayed level range may be scrolled by us ing the INC and DEC buttons as in normal mode of operation Setting the measurement duration Calibration The instrument has to be calibrated in the normal mode of operation The readout may b...

Page 191: ...ilable after LP anti aliasing filter Anti aliasing filter Pass band ripple 0 03 dB Stop band attenuation 100 dB Frequency range 0 9600 Hz 1 dB point Frequency resolution Δf 1 T 1 46 Hz 24000 214 Window function Hanning FFT function Auto spectrum Spectrum unit dB and EU Engineering units Averaging Linear power averaging Number of averages 1 to 1028571 Trigger Manual External Clock Level above Optio...

Page 192: ...ss mechanically connected to the accelerometer base through a piezoelectric material Piezoelectric materials have the property of producing electrical charge when bent and twisted even shear forces will work here Basically a charge is generated Depend ent of the type of transducer this charge may be the output signal or the transducer includes an ampli fier delivering an output signal with low imp...

Page 193: ...ower weight and may tolerate higher temperatures Nor4571 Set up for using an IEPE or CCP type of accelerometer con nected to Nor140 Power to the accelerometer is supplied from the instrument by selecting IEPE in the instrument menu as preamplifier IEPE type If you use an IEPE type of accelerometer with a known sensitivity it is easy to calculate the required sensitivity setting for the instrument ...

Page 194: ...is transferred to the sound level meter through the preamplifier Typical attenuation through the adapter Nor1447 2 and the preamplifier Nor1209 is 0 1 dB Select the Standard preamplifier in the instrument set up menu but switch off the polarisation voltage Charge type If you use a charge sensitive accelerometer you need to know the capacitance of all cables and accessories in addition to the charg...

Page 195: ...gular frequency ω 2πf This may also be used for more complex signals analysed in 1 3 octave bands or an alysed by the FFT option An example may illustrate how this is done Assume that the vibration level in the 80 Hz band 1 3 octave is assumed is 74 dB or 0 1 ms 2 The exact midband frequency for the 80 Hz filter is 101 9 79 43 Hz See ISO 8041 The vibration velocity is therefore The corresponding v...

Page 196: ...TUP 1 9 Misc par choose 5 Audiometer and toggle audiometer calibration function ON OFF with INC DEC keys Press ENTER repeatedly to confirm and leave menus Connect and calibrate Nor140 to an artificial ear for example Gras 43AA Play the desired tone frequency and level of the audiometer connected to the artificial ear Press STARTon Nor140 measurement time is by default 2 sec but can be changed by t...

Page 197: ...C61672 1 class 1 group X measuring exponential time weighted levels integrat ing averaging levels and sound exposure levels If 1 1 octave band or 1 3 octave band filters are installed the instrument complies with IEC 61260 class 1 The instrument also complies with the previous standards IEC 60651 type 1 and IEC 60804 type 1 The instrument conforms to a number of national standards such as DIN 4567...

Page 198: ...pin 5 7 15 1V preamp supply voltage max 3 mA Housing is GND instrument casing Highpass filter The input section is equipped with an analogue high pass filter to reduce noise from wind or other sources with frequencies below the frequency range for meas urements The filter is switched on if the limited fre quency range is selected 6 3Hz When this filter is Off the lower frequency is 0 4 Hz This set...

Page 199: ... type Digital true root mean square RMS detection and peak detection displayed resolution 0 1dB which may optionally be increased to 0 01dB for indicated levels in the range 9 99 to 99 99 dB Using remote control commands levels with 1 100 dB may always be read out Crest factor capability The crest factor is only limited by the capability to measure the peak value of the signal Time weightings and ...

Page 200: ...µV Typical values for the self noise are 5dB lower than the values stated The noise levels are measured without light in the display Please note that the octave and third octave filters re quire the options 1 and 3 respectively Z wide considerations The Z wide network requires several minutes to stabi lize at a low level The preamplifier between the mi crophone and the sound level meter is a very ...

Page 201: ...icrophone we recommend adjusting the sound level meter to indicate 113 8 dB diffuse cor rection off If other types of calibrators or electrostatic actua tors are used for the calibration we recommend ad justing the sound level meter to indicate the following levels referred to the sound pressure acting on the dia phragm of the microphone diffuse correction off Freq 125 Hz 250 Hz 1 kHz 4 kHz 8 kHz ...

Page 202: ...ar operating range is identical to the total range Frequency 3 15 Hz 31 5 Hz 1 kHz 4 kHz 8 kHz 12 5 kHz Upper level 137 dB 137 dB 137 dB 137 dB 137 dB 137 dB Lower level 50 dB 50 dB 50 dB 50 dB 50 dB 50 dB Ref level test 114 dB 114 dB 114 dB 114 dB 114 dB 114 dB Measurement range for C weighted peak levels Frequency 31 5 Hz 1 kHz 4 kHz 8 kHz 12 5 kHz Upper level 137 dB 140 dB 139 dB 137 dB 134 dB ...

Page 203: ...s the display The light switches off automatically 2 minutes after the last operation of any key The bar graph display covers 80 dB which may be scrolled in 10 dB steps to cover the total range Keyboard The keyboard is of silicon rubber type Adjustment of indicated levels Random response The instrument is equipped with a microphone with flat free field response and satisfies the class 1 requiremen...

Page 204: ...ment may measure levels 10dB higher than stated as the standard range The extend ed measurement range is obtained by reducing the sensitivity of the microphone through the application of a lower polarisation voltage When this option is se lected the polarisation voltage is lowered from 200V to about 70V A correction network is applied auto matically to compensate for the change in frequency respon...

Page 205: ...vating the preamplifier attenuation To activate the preamplifier attenuation press Press SETUP 1 Instr 4 Input 2 Correc tions to gain access to the Corrections menu Navi gate in the menu as usual and activate the correc tion parameter Preamp by means of the inc and dec keys Do the same to deactivate Preamplifier attenuation activated is indicated by a G for Gain in the lower line of the display Se...

Page 206: ...sing is designed to have low effects on the sound measured at the microphone The figure below shows the measured effect of the instrument casing at reference environmental conditions 0 15 30 45 60 75 90 105 120 135 150 165 180 165 150 135 120 105 90 75 60 45 30 15 0 2 4 6 8 1kHz 2kHz 4kHz 8kHz 12 5kHz dB 0 15 30 45 60 75 90 105 120 135 150 165 180 165 150 135 120 105 90 75 60 45 30 15 0 2 4 6 8 1k...

Page 207: ...e diagram shows the frequency response for an instrument with casing relative to the response for the microphone alone Effect of the windscreen Nor1451 for sound approaching the microphone from the front The diagram shows the frequency response for an instrument with windscreen relative to the response for an instrument without 0 1 2 1 2 10 100 1k 10k 100k Frequency Hz Level dB ...

Page 208: ...harming the instrument Input impedance 10 kohm connected to the positive supply 3 3 volt Any open input will therefore be in the high state Digital outputs The digital output signals are 3 3V CMOS signals Maximum output impedance 100 ohm During power up the output lines will be low or in a high impedance state 100 kohm to ground Pin Signal Dir Remarks 1 DO 1 Out Digital output 2 DO 2 Out Digital o...

Page 209: ...c range Overload RUN Output level is high 1 as long as the instru ment is in the Running status i e the Nor140 is making a measurement REC Output level is high 1 as long as the instru ment is making an audio recording of the input signal Some features in the instrument may force the digital output line into pre set settings which avoid the user from using the above selection for one or more of the...

Page 210: ...actured with SLC NAND Flash chips for extra long life and stability These cards have fewer errors in reading and writing than commercial SD cards Please note that no file in the system may exceed the 4 GB limit This file size is only possible to achieve with audio recordings and it corresponds to a recording of approximately 8 hours using 48 kHz sampling 24 bit resolution or 92 hours of 12 kHz 8 b...

Page 211: ...epth 30 mm Width 75 mm Length excl microphone preamplifier 210 mm Length incl microphone preamplifier 292 mm Weight incl batteries 410 g Information for conformance testing Reference Sound Pressure Level 114 0 dB re 20 µPa The reference frequency is 1000 Hz Reference Level Range The instrument has one level range only Microphone Reference Point and Direction The microphone reference point is the g...

Page 212: ...194 ...

Page 213: ...ure levels 153 Survey and engineering method 135 Terms and definitions for airborne sound insulation 134 Terms and definitions for impact sound insulation 135 C charge accelerometer 176 C weighting 22 Calibration 16 61 Engineering units 61 Calibrator 17 18 Charging 11 CIS value 170 Clearing 69 Clearing a single file 69 Clearing folders or the entire memory 69 Compensation 100 Diffuse sound fields ...

Page 214: ...I IEPE 7 174 175 IEPE accelerometer 175 interrupted noise method 115 ICP 83 Impact sound insulation 146 Terms and definitions for impact sound insulation 135 impulse response method 111 input terminal 83 interrupted noise method 113 K Keeping track of the measurement mode the file was stored in 70 Keyboard 15 Keyboard lockout 72 L language 14 level vs time 40 Listen Signal output 84 L t 44 Present...

Page 215: ...ype and level 98 Nor263A 87 91 NorXfer 77 NR rating 38 O Octaveband 31 Options See Extensions output control lines 191 P Password 77 Pause 23 The back erase feature 24 33 Polarisation voltage 11 power fail 11 Power Sound 118 Power supply 184 Preamplifier 13 187 Attenuation 187 Prepolarised microphone 12 pre trigger 90 Printouts 74 Profile 40 43 50 No back erase in profile pause mode 43 50 R Random...

Page 216: ...sing STOP before resuming 43 Storing 71 Automatic 71 Automatic storing 71 Manual 71 Repeat 72 Retrieving stored setups and data 66 Select the device for storing 64 Standard set up 67 Storage modes 71 Storing a measurement 66 Storing a measurement setup 64 Synchro 72 Swept Sine 158 Swept Sine reverberation 116 Synchro 72 T Table 44 Presenting the L t as a table 44 Technical specifications 179 AC ou...

Page 217: ...trigger 86 91 Setting the trigger condition 86 U Units 60 How values are indicated 60 USB interface 77 192 User defined table 28 V Velocity 177 vibration measurements 174 Virtual Instrument 82 W Weighting networks 181 W marker 53 Warm up time 193 Windscreen 100 186 Windscreen correction 186 Workload 7 Z Z weighting 22 ...

Page 218: ......

Page 219: ...ble 1m mains adapter Nor340 microphone preamplifier Nor1209 and microphone Nor1225 Setup Measurement duration 1h Frequency mode parallel 1 1 octave 2nd network Z During the RF immunity test the following was connected USB cable 1m microphone preamplifier Nor1209 and microphone Nor1225 Setup Frequency mode parallel 1 1 octave 2nd network Z Orientation Laying face up on the table and the microphone ...
Page 220: ...ics from sound calibrators microphones and preamplifiers via small handheld sound level meters to advanced yet portable real time analysers but also spectrum shapers building acoustics analysers and complete community industry and airport noise monitoring systems Contact your local representative or the factory for information on our complete range of instrumentation ...

Reviews: