NovaLynx Corporation
255-704-B
Page 13
April 2021
Replace the logger in the enclosure. Magnets on the back of the logger hold it in place. Press upward on
the plug that connects the evaporation gauge signal to the logger (
occasionally the signal connector gets
dislodged when the logger is moved to access the USB port
). Make a note of the time and date the
logger was started, along with the initial reading.
6.2
Upload Data
Connect your computer to the logger (Section 5.3). Click the "Readout device" icon. Select a file
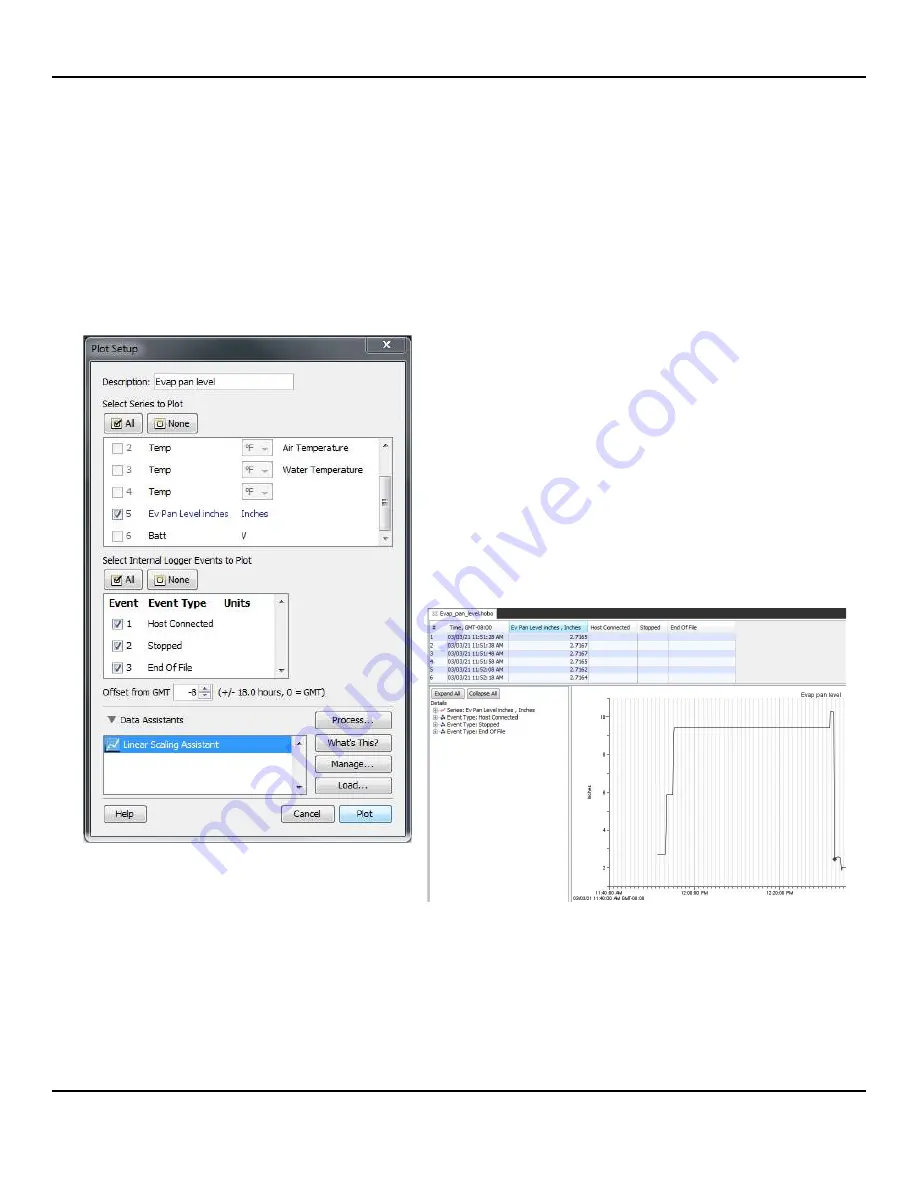
location and filename, then click "Save". Once the file is saved the "Plot Setup" screen will open. Select
the elements you want to display in graphical and tabular form, then click "Plot".
LEFT:
Plot Setup screen showing the
Ev Pan Level
check
box selected. The logger has three spare channels which
can be used for monitoring temperature or other
analog parameters. These channels can be selected to
plot on the same graph as the evaporation pan level, or
the file can be re-opened and selected sensors can be
plotted together.
BELOW:
The current log file is shown in tabular form
and as a graph. The data can be exported (.csv format).
Refer to the HOBOware manual for additional features,
or click the Help drop-down box.


