background image

TagTemp-NFC-LCD 


NOVUS AUTOMATION 

8/13


Fig. 16

 – Message for High Excursions for "No occurrences" 


Fig. 17

 – Message for Low Excursions for "No occurrences" 

9.2.5


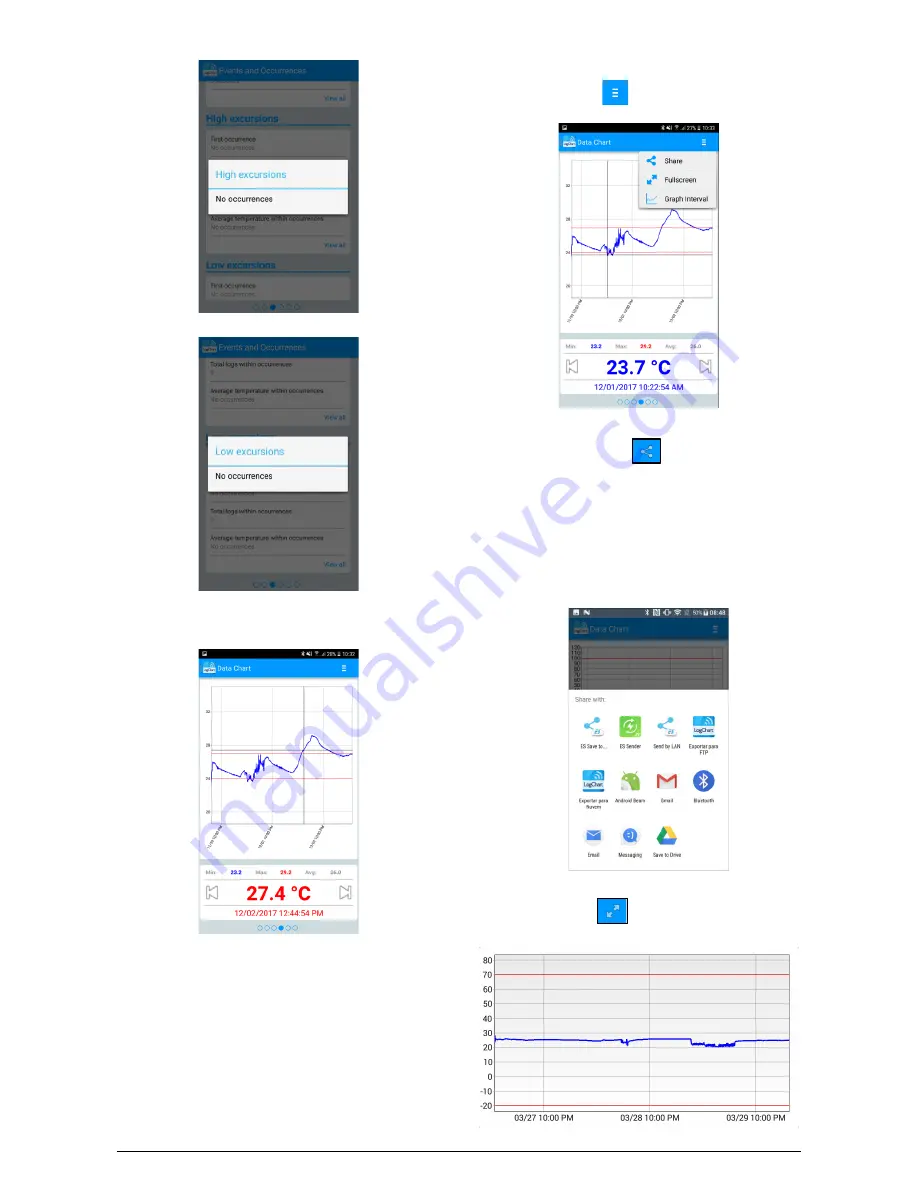
Data Chart 


Fig. 18

 – Data Chart Screen 

Screen where the user can view the historical data at different time 

intervals. You can also check the values that produced alarms, 

maximum, minimum and average value of the temperatures. 
Allow you to touch a point on the chart to see their value and its time. 

For a navigation record by record, you should use the "Previous" and 

"Next" arrows on the sides of the value shown. 
When more than 2000 data are registered, the graph will show only 

the last 2000. To select a graph display range, the "Chart range" 

option can be used. 

9.2.5.1


Data Chart Options Screen 

When you select the icon 

 in the upper right of the screen, the 

chart options will appear.  


Fig. 19

 – Data Chart Options screen 

1.


By pressing the icon 

, you can share the obtained 

data, using sharing applications already installed on the 

smartphone as well the option to send data to 

NOVUS 

Cloud

  (requires the  creation of an account in 

NOVUS 

Cloud

) and also the option to send to an FTP server 

(requires an active FTP server).  To include the 

geographical location of the data log in 

NOVUS Cloud

the GPS must be activated on the smartphone. 

The way in which the data will be shared is chosen in "Share with" in 

the 

Preferences screen


Fig. 20

 – Share Screen 

2.


“Full Screen” option 

:  with this option, the chart will be 

displayed in full screen in landscape mode. 


Fig. 21

 – Full Screen Chart 

Summary of Contents for TagTemp-NFC-LCD

Page 1: ...ON 1 13 TagTemp NFC LCD OPERATION MANUAL V1 0x CE Mark This is a Class A product In a domestic environment this product may cause radio interference in which case the user may be required to take adeq...

Page 2: ...want to measure the temperature Fig 01 Screw fastening Fig 02 Frame 3 TECHNICAL DATA Measure Range Temperature 40 0 C to 100 0 C Operating temperature From 10 C to 60 C Accuracy 1 C max over the full...

Page 3: ...display the minimum and maximum temperature values reset the minimum and maximum values when this option is configured and start and or stop the records depending on the configuration chosen To start...

Page 4: ...ent has occurred 6 3 Log Signaling LOG Remains lit while the device is logging or blinking every 1s when waiting for the Start Delay time 6 4 Low Battery Signaling Indicates that the battery is low vo...

Page 5: ...s Logging State Displays whether the device is recording data is stopped or is waiting for the start of the records Start Delay or overwriting old records Memory Usage Indicates if the circular buffer...

Page 6: ...record this occurrence to the memory Use Fahrenheit degrees when this option is enabled the temperature unit of Celsius default is changed to Fahrenheit Reset Minimum and Maximum Resets the minimum an...

Page 7: ...r limit of range Average Temperature within Occurrences Average value of the temperatures above the maximum range Low Excursions Indicates when the measured value exceeds the lower limit under the spe...

Page 8: ...aph display range the Chart range option can be used 9 2 5 1 Data Chart Options Screen When you select the icon in the upper right of the screen the chart options will appear Fig 19 Data Chart Options...

Page 9: ...application Initial screen selection Allows you to select the startup screen after reading the data from the device NOVUS Cloud Authentication Hire an account in the NOVUS Cloud to store the TagTemp...

Page 10: ...out the need of the device This setting can be saved to a file for future use or recorded to a connected device The Open Configuration option is used to read an existing configuration file The reading...

Page 11: ...with the new values Maximum and Minimum This option resets the maximum and minimum values when a configuration is sent Fig 34 Finalization Screen The Send Configuration and Extras screen is where the...

Page 12: ...1 Sharing and processing data After completing the download a screen will be displayed with the downloaded data and these are presented in two forms in graph form and table form In the same screen th...

Page 13: ...roperties 9 Reports Export Logs 10 Sending data to NOVUS Cloud 11 Exit 10 5Exporting and creating reports with the data downloaded Using the NXperience you can export the downloaded data to various fi...

Reviews: