TAGTEMP logger
NOVUS AUTOMATION UK TEL: + 44 (0) 870 321 8522 FAX: + 44 (0) 870 321 8523 web: www.novusautomation.co.uk email: Sales@NovusAutomation.co.uk | 4/7
6
OFFLOADING AND DATA VISUALIZATION
Data collected are send from logger to PC. Data can be collected any
time, at the end of the acquisition process or while they are being
acquired. If data collection takes place during the acquisition
process, the process will not be interrupted, following the logger
configuration.
It is important to "wake up" the logger before starting communication.
6.1
OFFLOADING DATA
Data offload is accomplished by clicking the button
Offload Data
:
During data transference, a status bar indicates remaining data to be
transferred. Data offloading time is proportional to the number of
readings logged.
6.2
VISUALIZING DATA
At the end of values transfer, data can be displayed in a graphical
form.
6.3
CHART WINDOW
It is possible to select a region of the chart to zoom in. Zoom
commands can be accessed through the
View
menu or through
zoom icons from the task bar.
It is also possible to select an area from the chart to zoom in by
clicking and dragging the mouse, thus creating a zoom region
starting from the upper left corner on the chart area.
The graphic curves can be vertically dragged with a right-click and
dragging the mouse up and down.
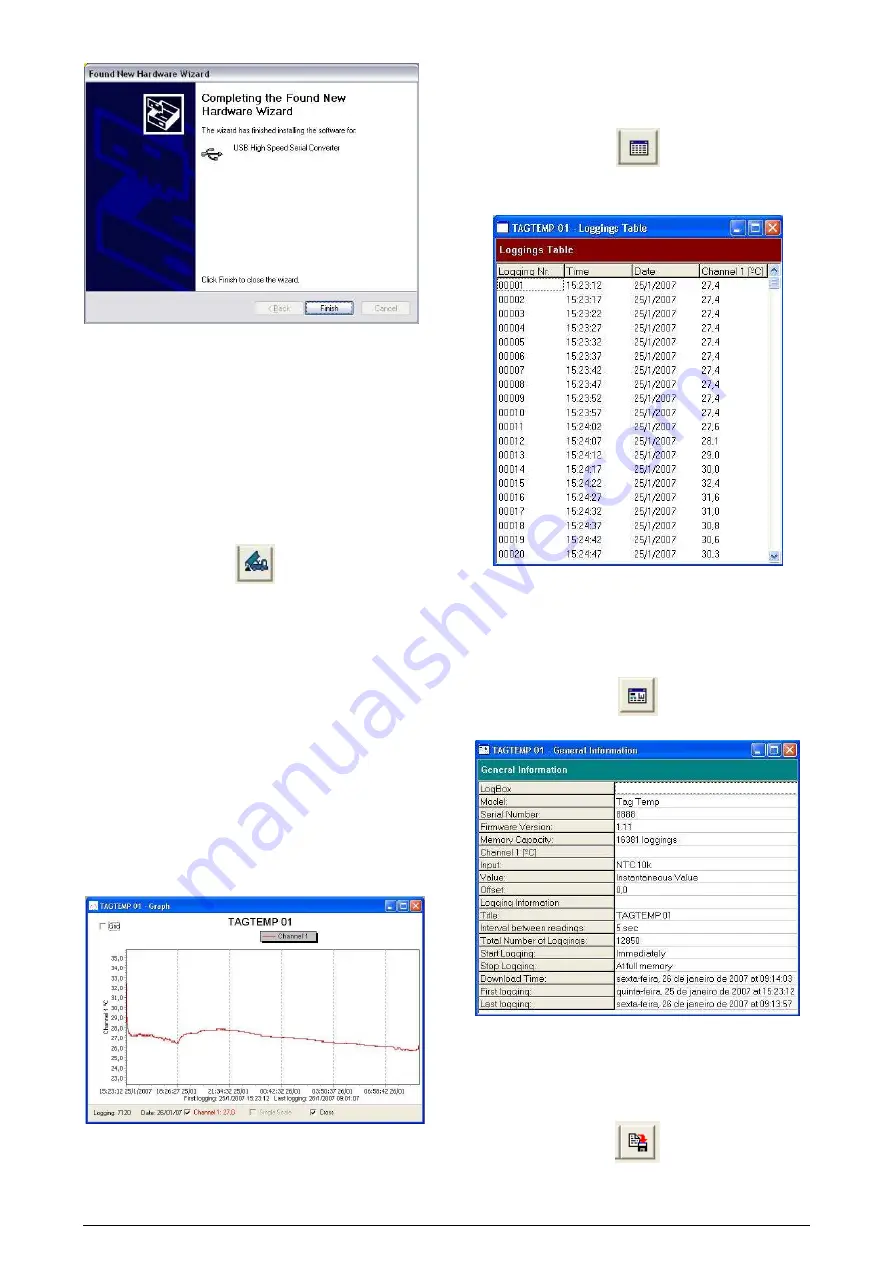
Figure 07 - Chart window.
6.3.1
MeasureS Table Window
To display measurements in a tabular form, press the icon
Table
View
:
Values are presented in a tabular form, listing the measurement time
and value.
Figure 08 – Screenshot showing the measurement table
6.3.2
General information table
This window shows some information about the logger whose data
were just read and its configuration. The screen can be displayed by
pressing the icon
Parameter Viewing:
Figure 09 – General Information Window
6.4
EXPORTING DATA
Logged data can be exported to different file formats, for further
analysis. To export, access File/Export or click the icon:


