TAGTEMP logger
NOVUS AUTOMATION UK TEL: + 44 (0) 870 321 8522 FAX: + 44 (0) 870 321 8523 web: www.novusautomation.co.uk email: Sales@NovusAutomation.co.uk |5/7
7
PDA USER
It is possible to set up the logger and collect acquired data with a
PDA that supports the Palm-OS system.
The application
LogChart Palm-OS
is shipped with the logger. The
stalled in the PDA through a HotSync process (data synchronization
between PDA and PC).
The user needs the
Palm Desktop
and the
LogChart II
software
installed in his machine. It is recommended to execute the Palm
HotSync
before installing the
LogChart PalmOS.
To install the software, insert the disk in the driver, click on Start and
Execute in the windows task bar. Type
d:\LCP_Setup,
where
d:
is
the disk driver unit. Press “OK”. The installation wizard will guide you
through the installation process.
Executing a new
HotSync
will install the
LogChart PalmOs
software
in the PDA. The LogChart icon will be added to the PDA home
screen.
Starting the
LogChart PalmOS
application will display the
Recorded
Data
screen on the PDA. Starting the LogChart PalmOS application
will display the
Recorded Data
on the PDA screen, where from it is
possible to access the logger to change settings and offload data, as
well as to access recorded data.
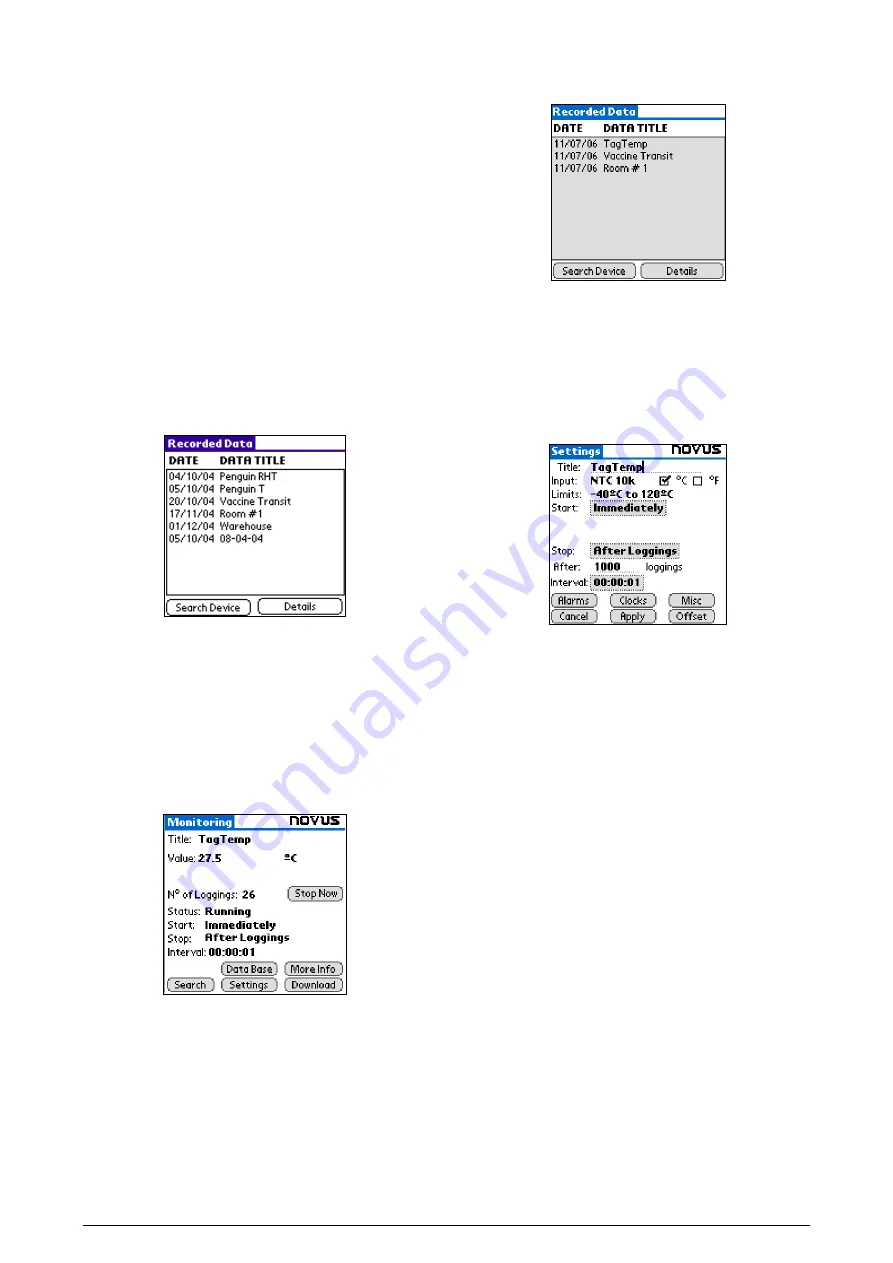
Figure 10 – Recorded Data screen
7.1
ACCESSING THE LOGGERS
To have communication between the logger and the PDA
established, the user must align the PDA infrared wand to the logger
communication window, run the LogChart Palm-OS software, wake
up the logger and press
Search Device
in the
Recorded Data
screen.
When the PDA finds the logger, the
Monitoring
screen will be
displayed. The screen displays values of variables measured,
configuration information and current logger status.
Figure 11 – PDA Monitoring screen
Buttons are assigned the following functions:
Search
: It allows "searching" for another logger or reconnect
communication lost for any reason. After finding a logger, the PDA
displays a new
Monitoring
screen.
Download
: Offload logged data. Download can be partial and it does
not interfere in the ongoing measurement process.
More Info
: Displays further information on the connected logger,
such as model, serial number, version and memory capacity.
Settings
: Accesses the Settings screen, which allows for modifying
the logger configuration.
Data Base
: Displays the
Recorded Data
screen listing all the
processes stored and processed in the PDA data base.
Figure 12 – Recorded Data Details screen
7.2
CONFIGURING THE LOGGER – SETTINGS
During configuration, the logger and the PDA ports must be aligned.
Press
Settings
in the
Monitoring
screen. The screen
Settings
is
opened and provides the required parameters for configuring the
logger.
Figure 13 – PDA Settings screen
The parameters to be defined are:
Title
: Name of the process.
Input
: Enables the user to select the temperature unit.
Start
(start of acquisitions): Defines the measurement start
mode. Options are:
Immediately
: The logger starts logging as soon as
configuration is sent to the logger.
By date/time
: Start in defined data and time, always after
current time. It is possible to perform daily repetitions. If this
option is selected, a new box to define the stop logging time
is displayed.
By <Start> Button
: Press the
Start_Now
button from the
Monitoring
screen to start logging. The PDA must be turned
towards the logger.
By Setpoint value
: Measurements start when a temperature
setpoint is reached. With this option it is also possible to start
measurements above (
log Above
) or below (
log Below
) a
temperature setpoint (channel 1). This option is not valid for
alarms that have already been set up.
By TagTemp button
: Starts when the
Start/Stop
button at
the frontal side of the logger is pressed.
Stop
: Defines the measurements stop mode: Options are:
Full memory
: Loggings can be stored
up to
the logger full
memory capacity is reached.
Wrap around
: Logging never stops. When the logger
maximum memory capacity is reached, oldest records are
overwritten by newest data.
After loggings:
The logging will stop after the number of
readings are defined.
By date/time
: Logging is stopped on user-defined date and
time.


