SymphoniePRO User Manual
Rev. 8
support@nrgsystems.com | Page 155
11 January 2018
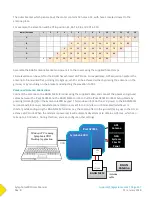
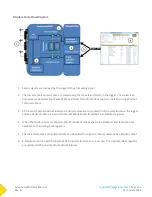
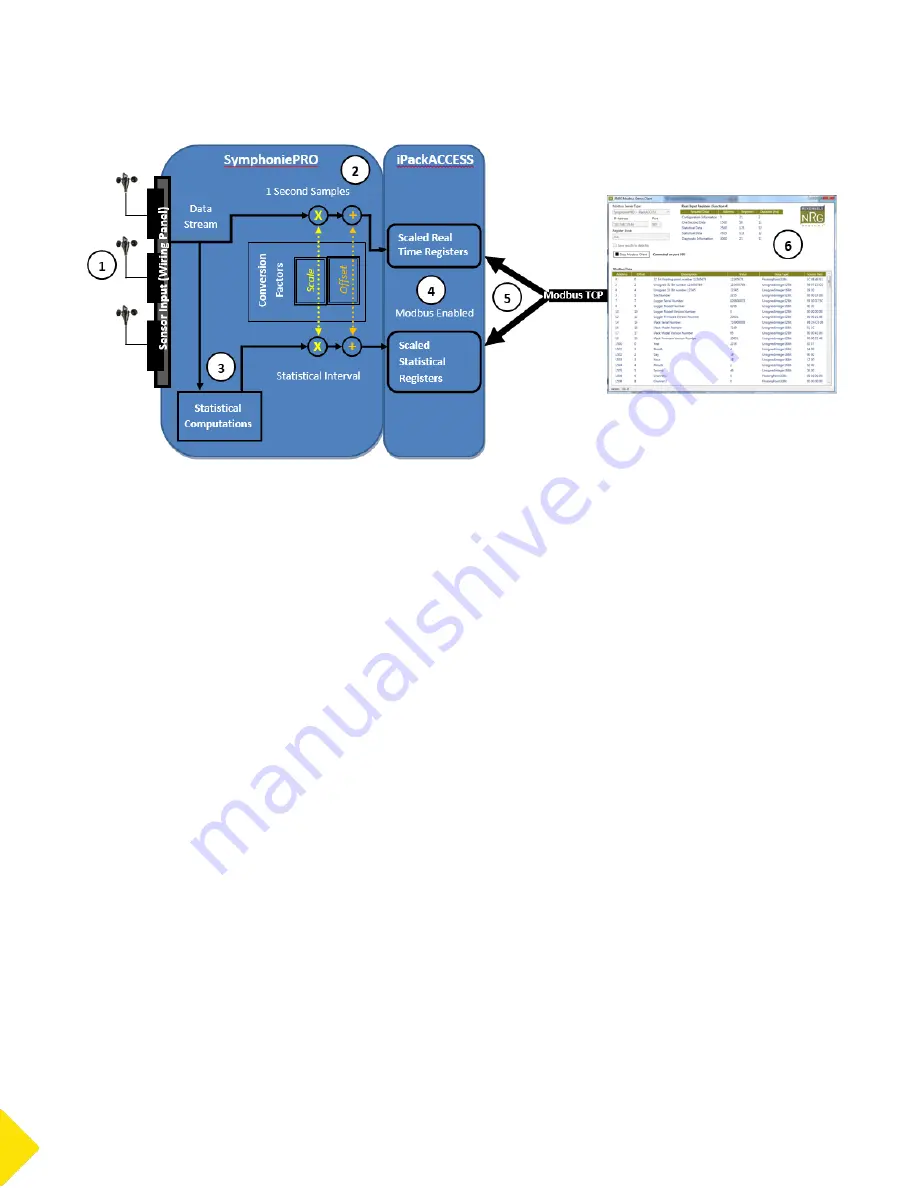
Modbus Data Flow Diagram
1.
Sensor signals are received by the logger through its wiring panel.
2.
The raw sample (1 second) data are scaled using the conversion factors in the logger. The scaled real-
time data are passed to the iPackACCESS and formatted into Modbus registers (detailed in the Modbus
Protocol section).
3.
At the end of each statistical interval, statistical values are computed from the sample data in the logger,
and the statistical data are passed to the iPackACCESS and formatted into Modbus registers.
4.
When the Modbus server is enabled, the iPackACCESS makes the scaled statistical and real time data
available on their designated registers.
5.
The scaled real-time and statistical data can be polled through an Ethernet network by a Modbus client.
6.
A Modbus client can poll the iPackACCESS registers for data once a second. The statistical data registers
are updated at the end of each statistical interval.
Summary of Contents for SymphoniePRO
Page 1: ......
Page 74: ...SymphoniePRO User Manual Rev 8 support nrgsystems com Page 74 11 January 2018 ...
Page 76: ...SymphoniePRO User Manual Rev 8 support nrgsystems com Page 76 11 January 2018 ...
Page 77: ...SymphoniePRO User Manual Rev 8 support nrgsystems com Page 77 11 January 2018 ...
Page 78: ...SymphoniePRO User Manual Rev 8 support nrgsystems com Page 78 11 January 2018 ...
Page 134: ...SymphoniePRO User Manual Rev 8 support nrgsystems com Page 134 11 January 2018 ...
Page 137: ...SymphoniePRO User Manual Rev 8 support nrgsystems com Page 137 11 January 2018 ...
Page 139: ...SymphoniePRO User Manual Rev 8 support nrgsystems com Page 139 11 January 2018 ...
Page 142: ...SymphoniePRO User Manual Rev 8 support nrgsystems com Page 142 11 January 2018 ...

