®
12
tions on nitrogen loading, only the TLBG will be displayed, or if calculations are
based upon oxygen loading, only the O2 bar graph will be displayed.
Immediately after a dive, various information is stored in the DataPlus’ memory
and can be viewed by accessing the Dive Log Mode. This gives you a opportu-
nity to record data in your log book before it is eventually overwritten by subse-
quent data. Your latest 12 dives are stored and can be viewed by pressing the
control button.
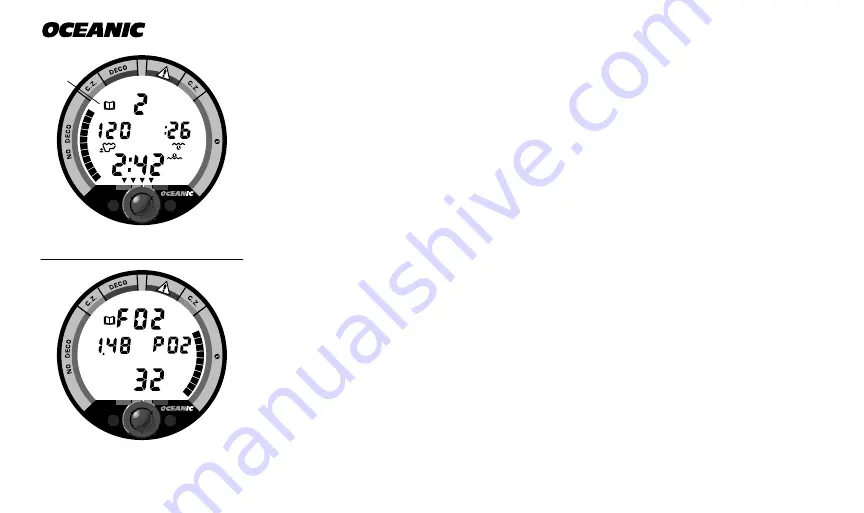
Dive Log Mode signified by the Dive Log icon (Fig. 16a) will automatically scroll
through the latest 12 dives, starting with the most recent dive first. Two screens
are displayed for each dive, one showing data associated with nitrogen and the
other showing data associated with oxygen.
The Nitrogen Log (Fig. 16) displays the dive number (#), surface interval prior
to the dive (and Surface mode icon), maximum depth (and Max Depth icon),
elapsed dive time (and Elapsed Dive Time icon), maximum ascent rate (VARI)
attained at any time during the dive, and end of dive tissue loading (TLBG). The
Oxygen Log (Fig. 17) displays 'FO2', the FO2 value set prior to the dive, and the
maximum level of oxygen loading reached during the dive as the O2 bar graph.
If you have acquired the OceanLink™ PC interface software package, you will be
able to download (copy) dive data from the DataPlus to your personal dive log
that you established in your PC.
O2
FT
MAX
GLO
DATA
PLUS
Fig. 17 - Oxygen Log
O2
GLO
DATA
PLUS
Fig. 16 - Nitrogen Log
a
Summary of Contents for DATA PLUS
Page 1: ...owner s guide DATA PLUS OCEANIC R3 ...
Page 2: ... ii ...
Page 11: ...FEATURES OVERVIEW ...
Page 27: ...DETAILED OPERATIONS ...
Page 53: ...HANDLING THE EXTREMES ...
Page 73: ...CARE MAINTENANCE ...
Page 85: ...REFERENCE ...
Page 105: ...DataPlus 95 ...


