9
Datamax Pro Plus
20
0 5
10
30 40 50 60
NO DECO
C Z
DECO
C Z
O
2
PSI
FT
FT
MAX
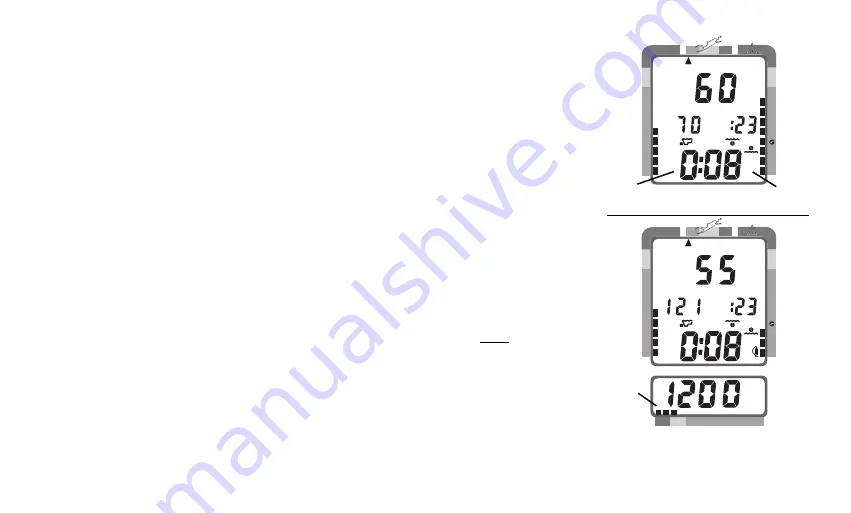
before reaching the oxygen exposure limit decreases, segments are added to
the O2 bar graph. When the amount of time remaining before reaching the
oxygen limit becomes less than the No Decompression Dive Time Remaining,
or Breathing Gas Time Remaining, calculations for that depth will be con-
trolled by oxygen. Oxygen Time Remaining will then appear as the main nu-
meric time display (Fig. 9a) as signified by the O
2
Time icon (Fig. 9b) appear-
ing on the display. As oxygen accumulation continues to increase, the O2 bar
graph will enter the yellow Caution Zone (described later).
Breathing Gas Time Remaining
Breathing Gas Time Remaining will appear as the numeric Dive Time Remain-
ing display (Fig. 10) only when it is less than No Decompression Time Remain-
ing and Oxygen Accumulation Time Remaining. Breathing Gas Time Remain-
ing of 60 minutes, or less, will be displayed continuously as the Gas Time Re-
maining Bar Graph (Fig. 10a) regardless of which time is being displayed as
the numeric Dive Time Remaining. The bar graph represents only Breathing
Gas Time information and it will be the only indication of breathing gas time
remaining if you are in a decompression or violation mode.
The Pro Plus calculates Breathing Gas Time Remaining using a patented algo-
rithm that is based on a diver's individual breathing gas consumption rate and
depth. Tank pressure is measured once each second, and an average rate of
consumption is calculated over a 90 second period. This rate of consumption is
Fig. 10 - Breathing Gas Time
Remaining
a
Fig. 9 - O2 Time Remaining
NO DECO
C Z
DECO
C Z
O
2
FT
FT
2
O
MAX
a
b


