APPLIED OPERATIONS
/Changing the Image Display Method
OPERATION INSTRUCTIONS
2 - 2 0 2
Page
2-5-2-2 LUT Graph Editing by Gamma Correction
The intensity data of an image can be reallocated to
make it easier to view.
1. Display the image window of the image to be
subjected to LUT change.
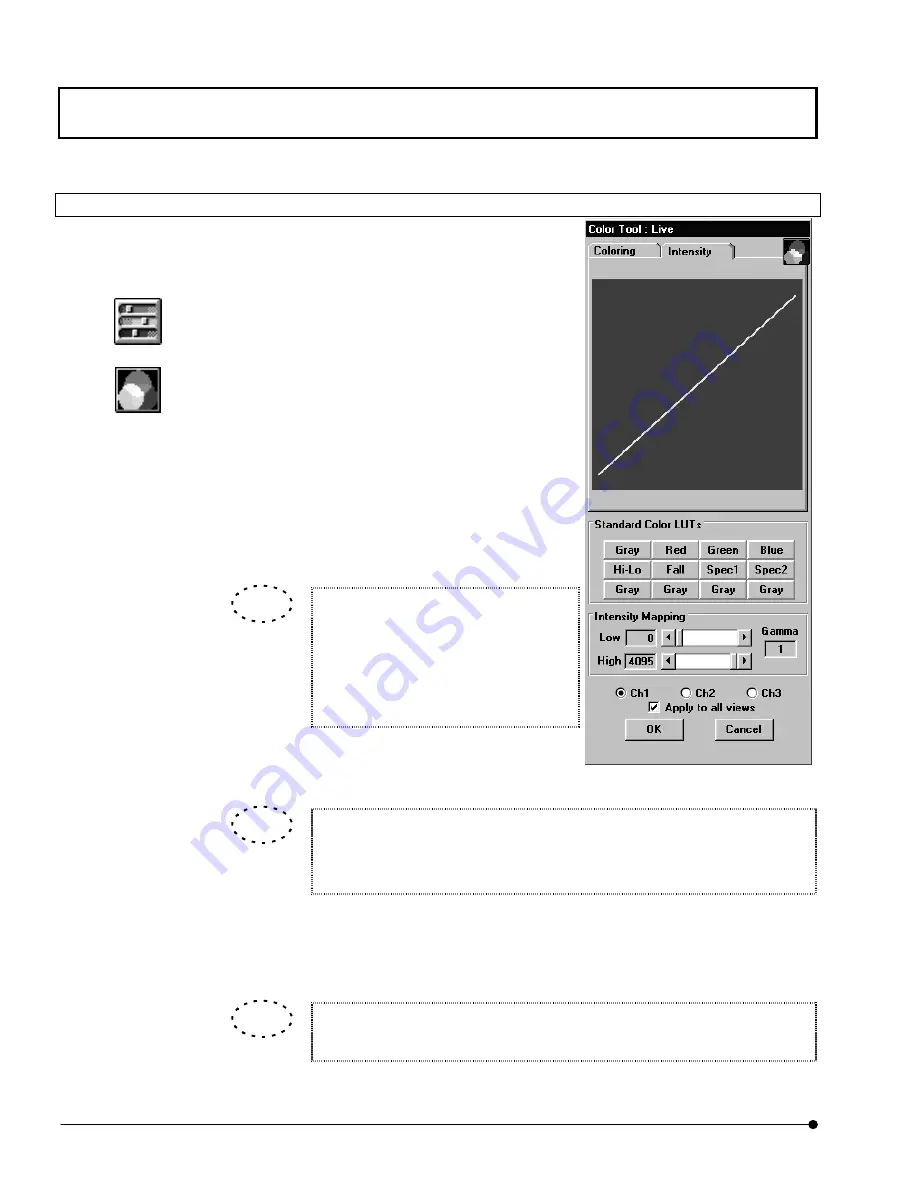
2. Click the <LUT> button in the toolbar. The [Color
Tool] dialog box appears as shown in Fig. 2-64.
3. Click the <Graph display> button on the top right
of the [Color Tool] dialog box. The intensity graph
of the LUT appears in the [Intensity] dialog box.
4. Set the range of intensity graph application with
the [Low] and [High] scales in the [Intensity
Mapping] group box.
Dragging one end of the graph makes it
possible to change the inclination. The
set intensity graph is immediately
reflected in the image in the image
window.
Double-clicked the [Low] scale, [High] scale and [Gamma] text box, they are
reset to the default values (“0” with the [Low] scale, “4095” or “255” with the
[High] scale and “1.0” with the [Gamma] text box).
5.
The gamma value can be changed by dragging on the graph. The set intensity graph is
immediately reflected in the image in the image window.
The gamma value can also be changed by entering a value in the [Gamma] text
box in the [Intensity Mapping] group box.
Fig 2-66 LUT Intensity Graph
Display
<LUT> button
<Graph display> button
TIP
TIP
TIP


