APPLIED OPERATIONS
/Image Processing
OPERATION INSTRUCTIONS
2 - 2 5 3
Page
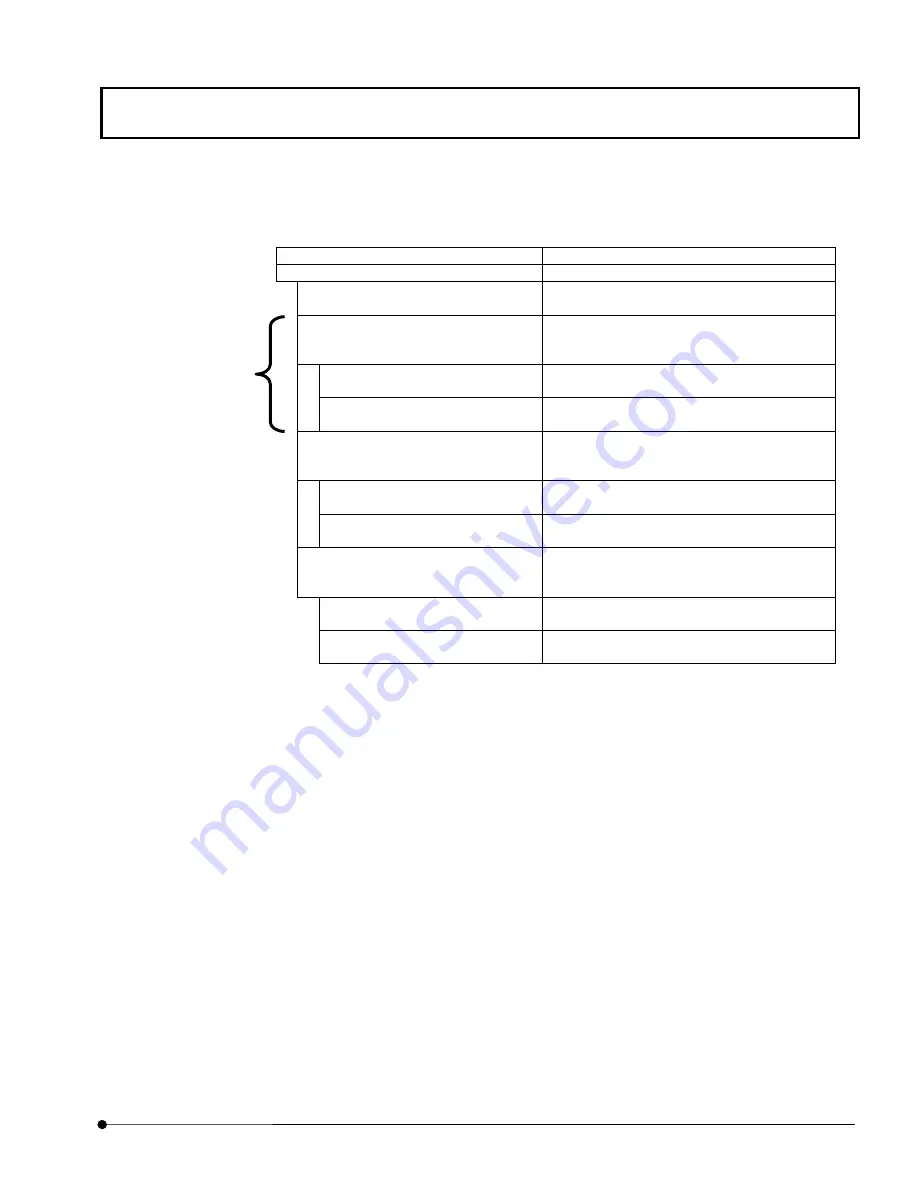
Explanation of [Annotation] Text Box (In case that 3 pictorial figures exist. Items
(1)
will be
increased according to number of pictorial figures.).
Display in Text Box
Explanation
Regions Annotation
Regions Mode
Total
samples
in
histogram
Total numbers of image pixels to be
processed
RGB:
1st pictorial figure. Color of rectangular: To
be displayed in 256 gray scale (Red, Green,
Blue)
Samples
inside
region:
Total numbers of image pixels inside
rectangular and ratio to whole region
Samples outside region:
Total numbers of image pixels outside
rectangular and ratio to whole region
RGB:
2nd pictorial figure. Color of rectangular: To
be displayed in 256 gray scale (Red, Green,
Blue)
Samples
inside
region:
Total numbers of image pixels inside
rectangular and ratio to whole region
Samples outside region:
Total numbers of image pixels outside
rectangular and ratio to whole region
RGB:
3rd pictorial figure. Color of rectangular: To
be displayed in 256 gray scale (Red, Green,
Blue)
Samples
inside
region:
Total numbers of image pixels inside
rectangular and ratio to whole region
Samples outside region:
Total numbers of image pixels outside
rectangular and ratio to whole region
(1)


