APPLIED OPERATIONS/
Image Analysis
OPERATION INSTRUCTIONS
2 - 2 8 2
Page
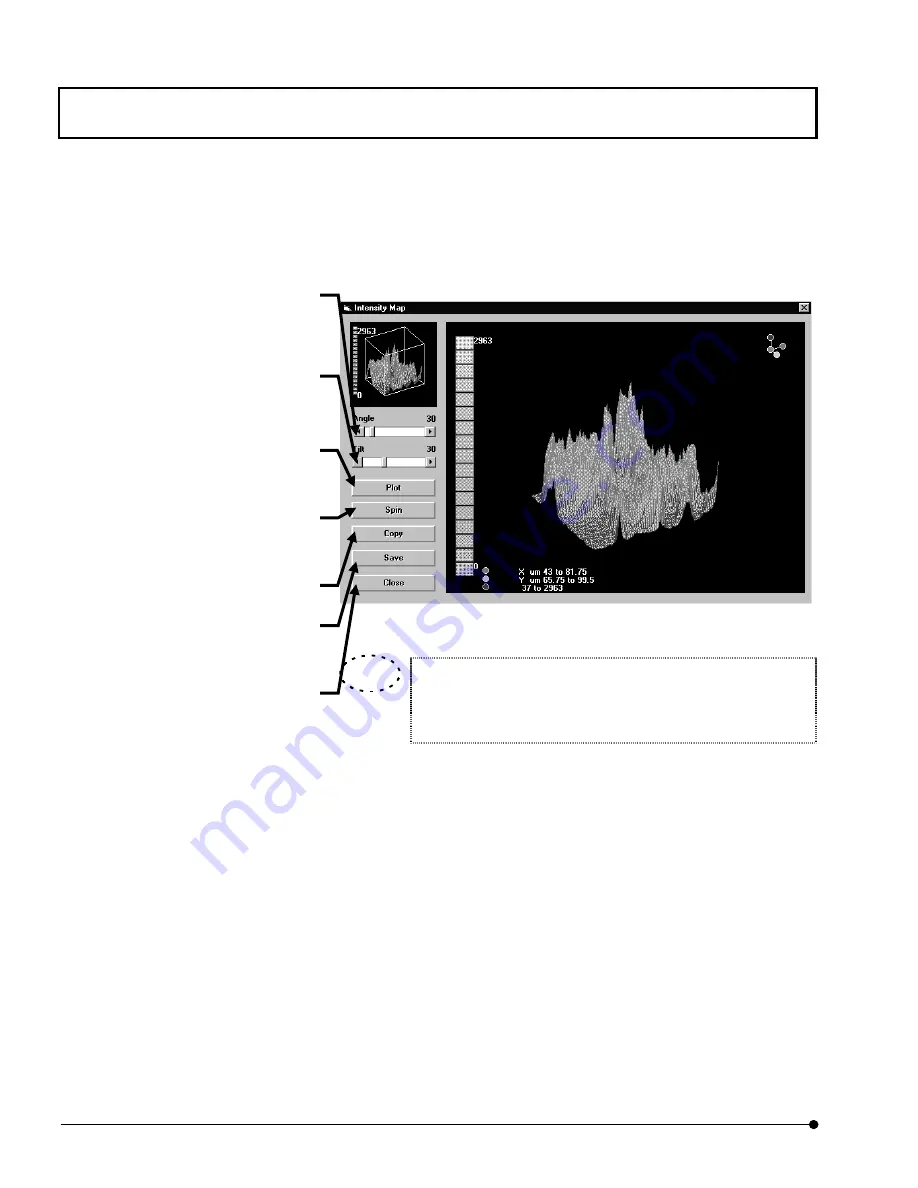
10. Double-click the [Intensity Profile] button. The [Intensity Map] window appears as
shown below.
Fig. 2-110 [Intensity Map] Window
The displayed data can be utilized in other applications.
See section 2-11, “Transferring Data to Another Application” for
details.
<Save> button
Saves the profile data in a file using an
Excel-compatible format.
<Copy> button
Copies the plotted image in the
clipboard.
<Close> button
Quits the [Enhanced Profile Plot]
window and returns to the [Analyze]
[Tilt] scale
Sets the angle in the vertical direction.
The result can be confirmed with the
small bird’s eye view in the frame on the
top left.
[Angle] scale
Sets the angle in the horizontal
direction.
The result can be confirmed with the
small bird’s eye view in the frame on the
<Plot> button
Displays the bird’s eye view with the
angles set above.
<Spin> button
Spins the bird’s eye view by one turn.
The spinning starts from the front.
TIP


