APPLIED OPERATIONS
/Changing the Chart Display Method
OPERATION INSTRUCTIONS
2 - 3 4 8
Page
2-15 Changing the Chart Display Method
When the processed analysis data chart in the [Analyze] panel is double-clicked, the
[Enhanced Profile Plot] dialog box appears.
By clicking the <Properties> button, the [Editing] dialog box can be displayed, allowing the
detailed chart settings and chart display method to be changed.
2-15-1 [Chart] Panel
z
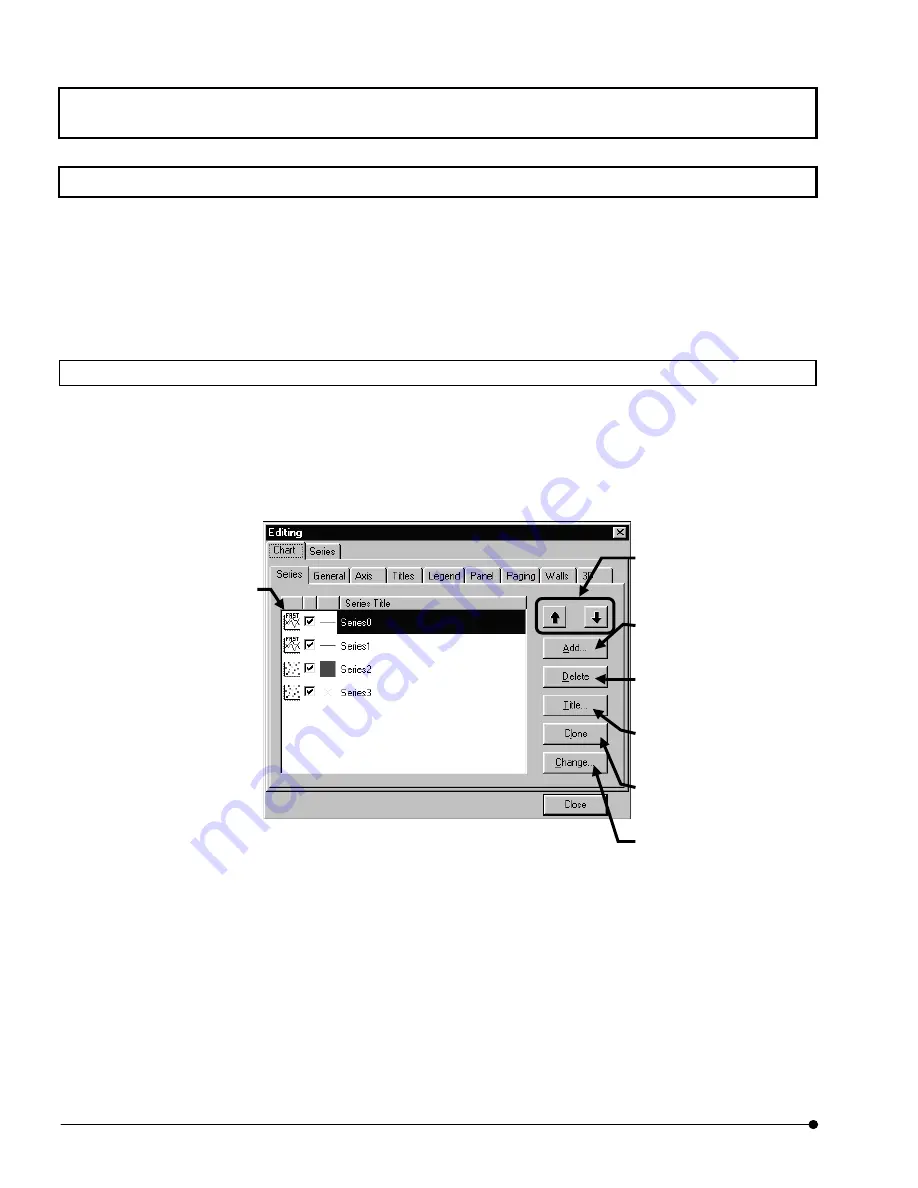
[Series] panel
This panel is used to change the type, title or other settings of the displayed chart as
well as to add or delete charts.
List of displayed charts.
Move the positioning of the
chart selected in the [Series
Title] box.
Adds the chart selected in
the [Series Title] box by
specifying the format.
Deletes the chart selected in
the [Series Title] box.
Re-titles the chart selected in
the [Series Title] box.
Copies the chart selected in
the [Series Title] box.
[Changes the type of the
chart selected in the [Series
Title] box.


