APPLIED OPERATIONS
/Changing the Chart Display Method
OPERATION INSTRUCTIONS
2 - 3 5 6
Page
2-15-2 [Series] Panel
z
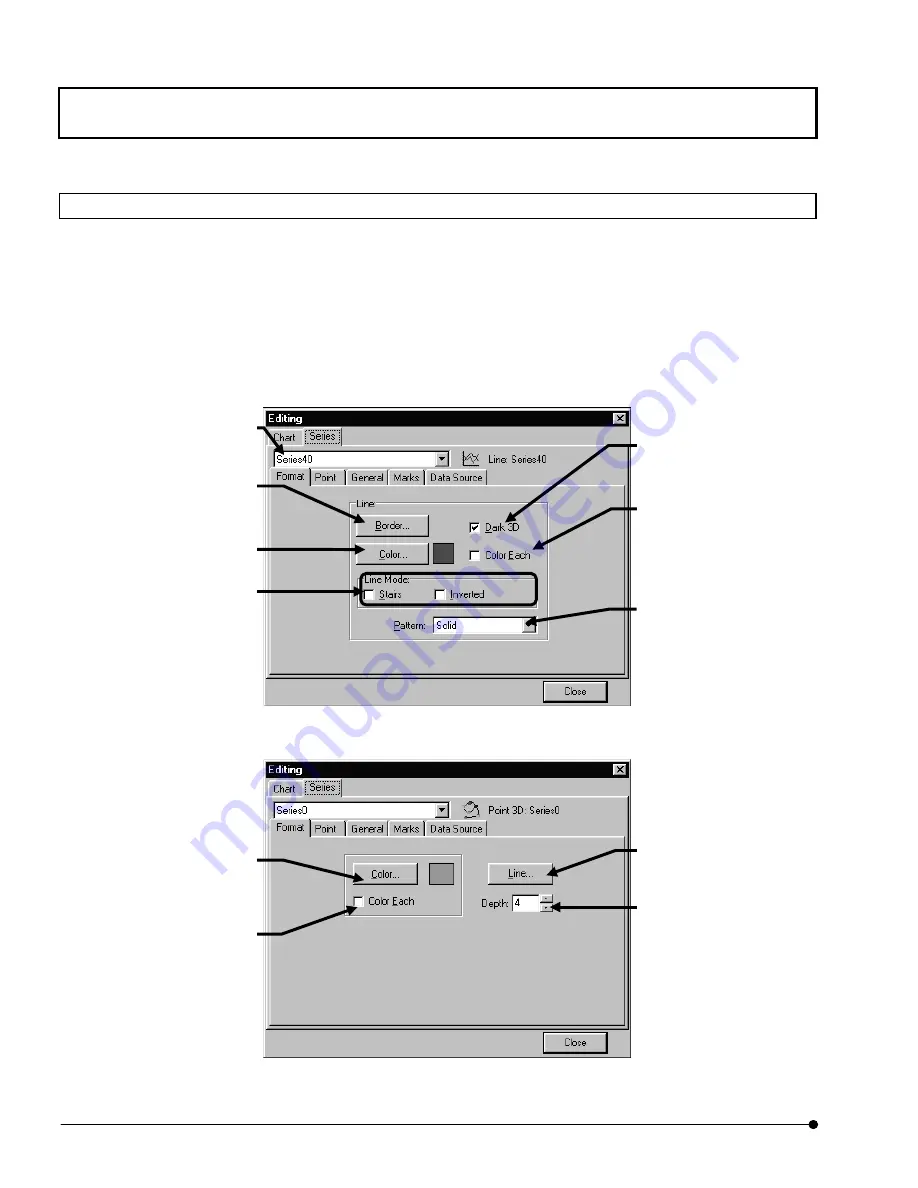
[Format] sub-panel
Used to set the display method of a series of images.
The set items are variable depending on the type of the chart.
The following descriptions take a Line 3D chart and Point 3D chart as examples.
This is the [Format] sub-panel when the Line 3D chart is selected.
This is the [Format] sub-panel when the Point 3D chart is selected.
Sets the chart color.
Enables or disables the
coloring per coordinate
axis.
Sets the chart pattern.
Sets the chart color.
Enables or disables the
display varying the color at
every point in the chart.
Sets whether or not
chart lines are displayed,
and sets the color, width
and type.
Sets the depth of points
in the chart.
Select the chart series to be
set in the [Series] panel.
Sets whether or not the outer
frame of the chart is
displayed, and sets the color,
width and type
Enables or disables the
stairstep type chart display.
Enables or disables the
shadowed 3D display.


