3-50
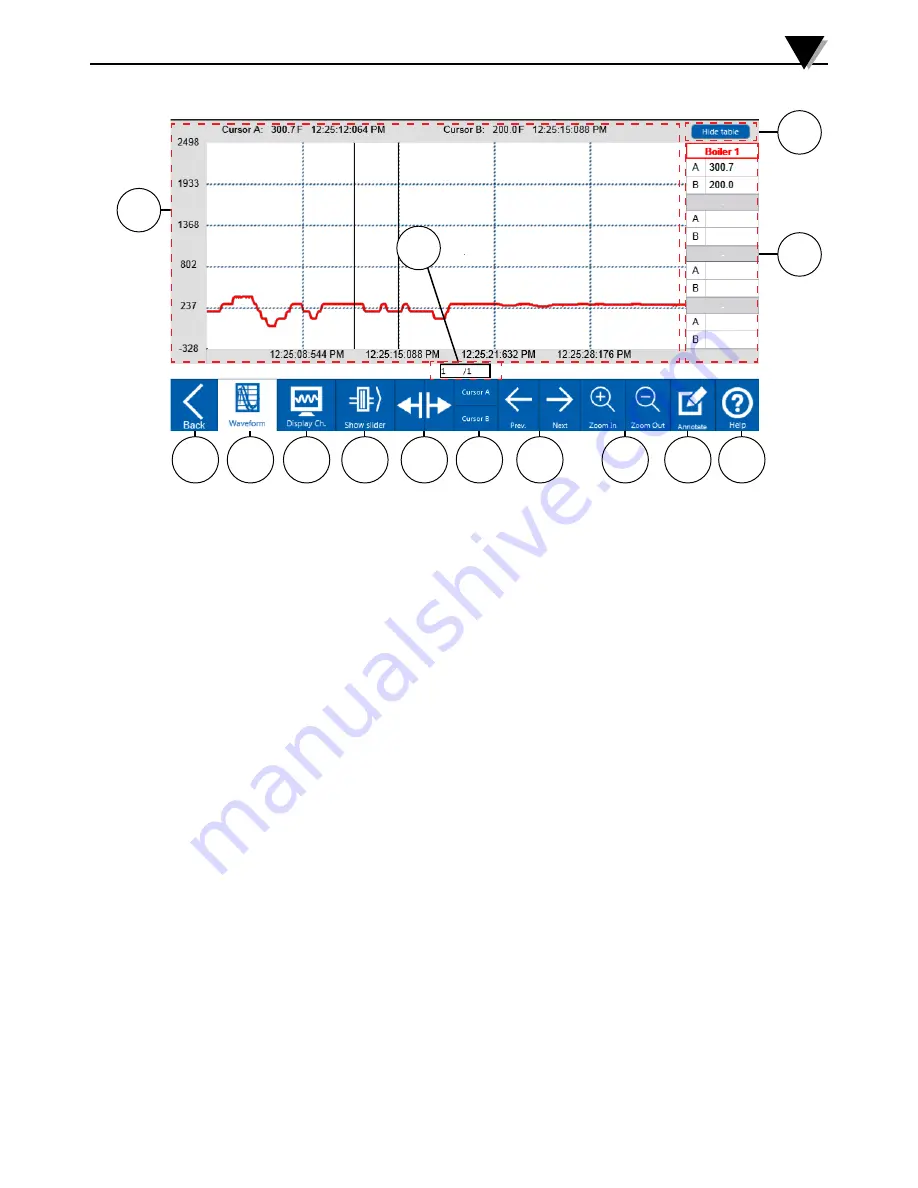
After selecting a particular file for review and pressing the Review button, the
data logger will load the file and show the data review screen.
Standalone Operation
3
Figure 3-59 Data Review Screen
1
2
3
5
6
7
8
9
10
11
12
13
14
4
1. Waveform Graph
Shows a graphical plot of data for the file currently under review. Information
displayed includes the y-axis scale for the channel currently highlighted,
timestamp indicator, engineering unit value for the currently selected channel
at each cursor location and time value at for each cursor.
2. Hide Table
Hides or shows the table showing the channel data values at each cursor
location.
3. Cursor Table
Table showing the channel data values at each cursor location. Tapping on a
channel name will show the corresponding channels data values at each cursor
location on the top of the graph.
4. Page indicator
Shows the current page displayed and the total number of pages at the current
zoom level.
5. Back
Returns to the stored files list for the currently selected memory location.
6. Waveform
Shows the waveform view of the file under review.
7. Display Channels
Navigates to the channel list for the file currently under review. Here you can
select the channels you wish to have displayed on the waveform view.
8. Show slider
Shows a slider tool that can be used to quickly move to different pages of the
file under review.
9. Cursor Controls
Moves the selected cursor forward or backward in time on the waveform
display.
10. Cursor selection
Selects the cursor you wish to move using the cursor controls.
A single cursor or both cursors can be selected.
Summary of Contents for OM-DAQXL
Page 75: ...4 1 NOTES 4...


