Personal Daq User’s Manual
878395
Unit Startup 1-11
Quick Start for Personal DaqView
Once your Personal Daq system has been properly connected to the PC and to the desired input signals, the
following steps may be used to start Personal DaqView and begin collecting data. For this “Quick Start” approach
to collecting data we will be making use of the program’s default settings.
Note that acquisition settings can be changed from the
Configure Acquisition Window
. This window is accessed via
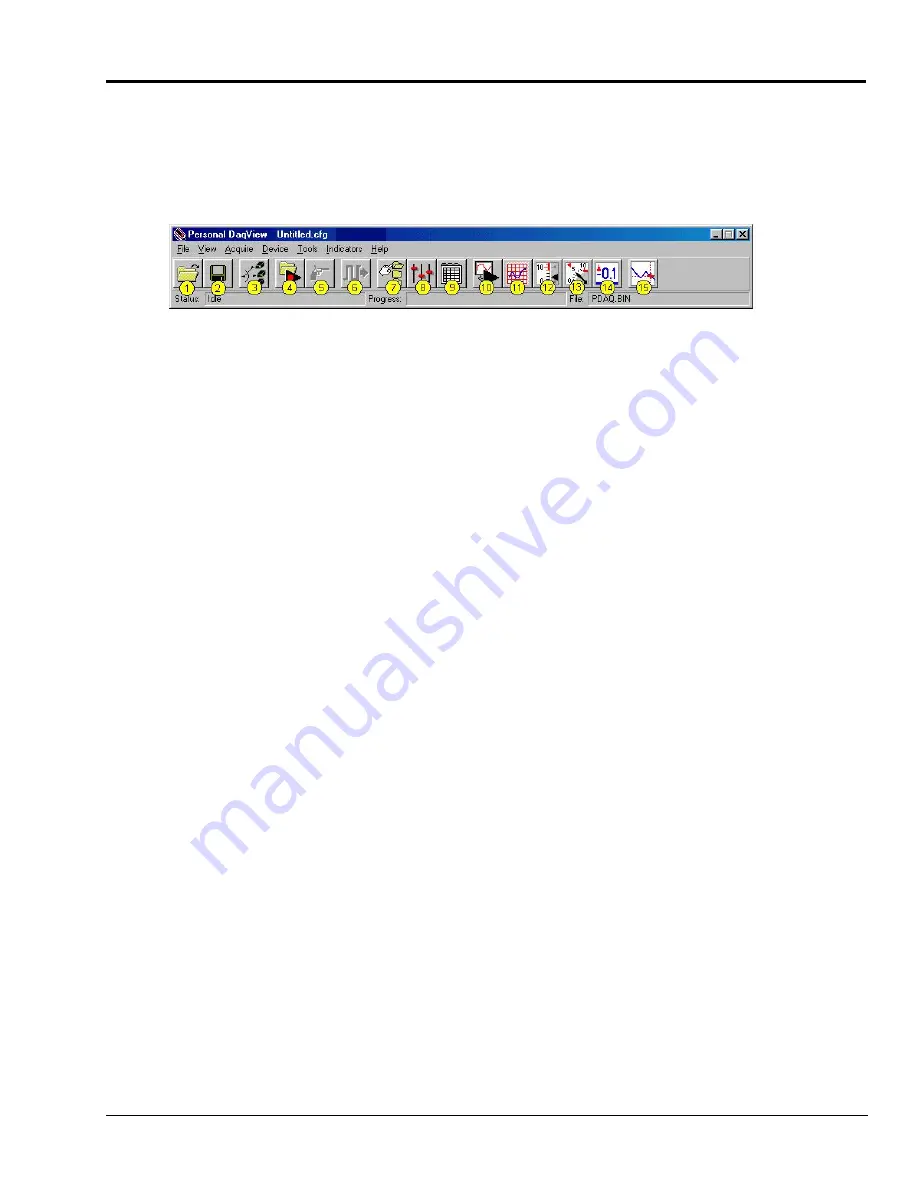
button (8). Refer to the following figure for location.
When you first open Personal DaqView the
Main Control
and
Channel Configuration Windows
appear. These are
portrayed on the following page. The
Channel Configuration Window
appears with the Analog Input spreadsheet
opened, and with channel PD1_A01 turned “On.” Tabs on the window (see following figure) allow for a quick
transition from one spreadsheet to another.
1.
From Windows, open Personal DaqView by double-clicking on the Personal DaqView icon, or by using the
Windows Desktop Start Icon to access the Personal DaqView program.
Once the program is executed, the software identifies your Personal Daq device and brings up the
Main Control
Window
and
Channel Configuration Window
(with the Analog Input Spreadsheet Selected).
Note:
If the
Channel Configuration Window
is not visible, click button (9).
2.
Select the tab for the desired spreadsheet.
Analog Input
is the default. Note that the
Frequency/Pulse Input
and
Digital Input/Output
tabs do not apply to Personal Daq/54.
3.
Ensure the desired channels are enabled. Double-click in a channel’s On/Off cell to enable or disable a
channel, as applicable.
4.
If you want to record data to disk
, click on button (4) Arm Trigger for Disk Recording. The data acquisition
begins and data is stored to a disk file as indicated in the Data Destination Window. Note that the default
destination, including the default file name of
PDAQ.BIN
, is as follows:
C:\PROGRAM FILES\PDAQVIEW\PDAQ.BIN
. You can, of course, specify a different location.
5.
To see real time readings on the Channel Configuration Window
, click on button (10) Update All Indicators
or button (16) Enable Readings Column. The location of button (16) is indicated on page 1-8.
6.
If you want to read data, but not record to disk
, click on button (10) or (16), but not button (4). In addition to
the Channel Configuration Windows reading column, you can click on one or more display icon buttons (11,
12, 13, or 14) to see your data in the form of a chart or meter. You can view all display types, or a combination
of them, at the same time.
Display options, listed as button number followed by display type, are:
o
(11) scrolling charts
o
(12) bar graph meters
o
(13) analog meters
o
(14) digital meters
Artisan Technology Group - Quality Instrumentation ... Guaranteed | (888) 88-SOURCE | www.artisantg.com


