33
the “ Display
“
button. This is used to know the time when the treatment is done
during the measurement. The markers are stamped as “ M “ in the Excel file
made by “ Analyze Images” in “ Tools “ in the menu bar.
13) Function of the menu bar
(1) File
(a) Capture Screen : The whole display can be save in the clip board. This
saved image can be used to attach on some documents.
(b) New Analysis : Select this “ New Analysis
“
for different saved images.
(c) Load Images : Same function as “ Load Images
“
in 1).
(d) Save Images : The Color Blood Flow Image shown on the display is
saved.
(e) Exit : LIA program is exited.
(2) Tools
(a) Play Movie : This function plays the movie of saved sequential images.
(b) Make Color Image Sequence : This function saves the blood flow images
as the sequence color images.
(c) Make AVI : The AVI file is directly made from saved sequential images.
(d) Save Histogram : This function saves the histogram of the blood flow
distribution inside ROIs.
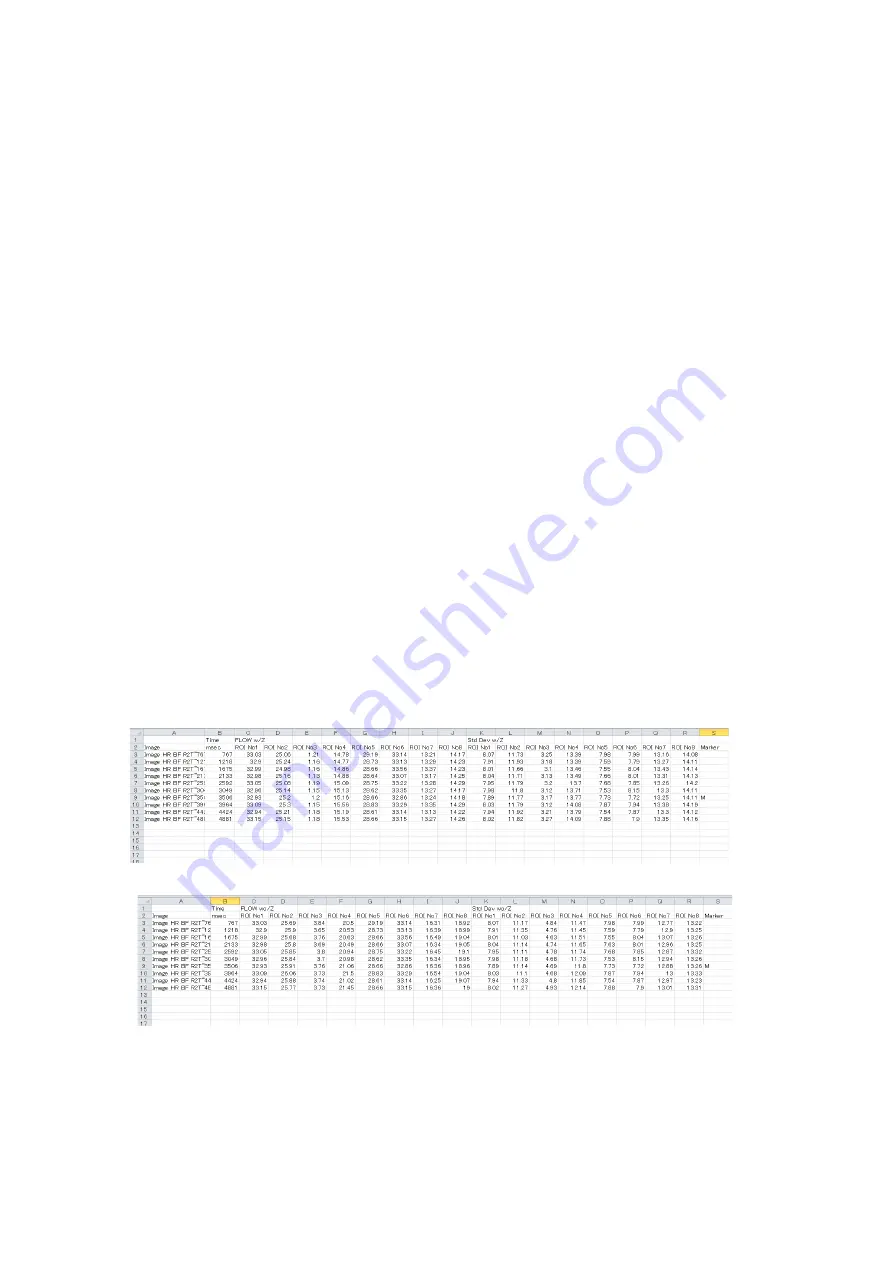
(e) Analyze Images : This function makes the Excel file of sequential blood
flow values and its standard deviation in ROIs.
Example 1 : EXCEL file with zero value
Example 2 : EXCEL file without zero value
(3) Color Bar : One of the four color bars
can be selected.
Standard : standard color distribution
Enhanced : Red and blue regions are wider than Standard color bar.
Gray Scale : Color bar in black and white


