background image

Bode 100 - Information 

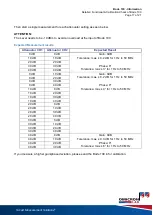
Detailed Functional & Calibration Check of Bode 100 

Page 20 of 21 


Smart Measurement Solutions 

Smart Measurement Solutions

®


After that, please start a continuous sweep. 

Expected measurement results: 

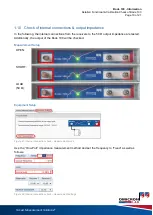
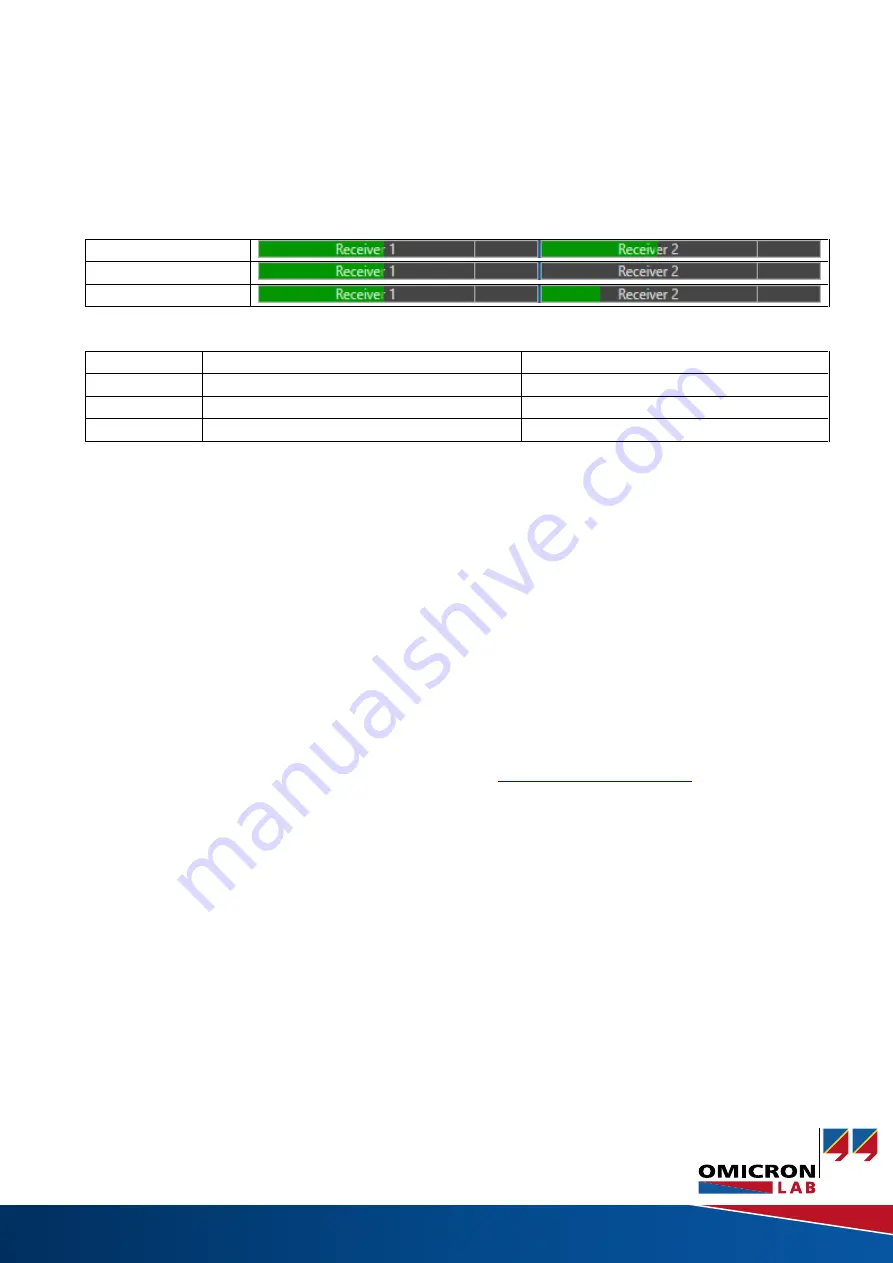
Receiver levels should look similar to the following when source frequency is set to 1 kHz: 

OPEN 


SHORT 


LOAD 

(50 Ω) 


In the following, the source frequency must be changed between 1 kHz and 100 kHz. 


1 kHz 

100 kHz 

OPEN 

>85 k

Ω               (typ. 100 kΩ) 

>75 k

Ω               (typ. 90 kΩ) 

SHORT 

<20 mΩ              (typ. 10 mΩ) 

<5

0 mΩ              (typ. 10 mΩ) 

LOAD 

(50 Ω) 

<51 Ω & >49 Ω   (typ. 50 Ω) 

<51 Ω & >49 Ω   (typ. 50 Ω) 


2  Calibration service 

ISO9001 Factory Calibration 

Calibration and adjustment of the Bode 100 is performed in our ISO 9001-2008 certified development 
center. If a unit is sent in for calibration, we perform a complete factory calibration including 
adjustment like during manufacturing. This ensures that the Bode 100 has the same accuracy as 
when it was manufactured. 
 

IEC17025 Calibration 

Together with an external calibration lab we offer an ISO/IEC17025 calibration as an add-on to our 
factory calibration. 
 
For further information please contact our support team: 

support@omicron-lab.com


Summary of Contents for Bode 100

Page 1: ...Y CALIBRATION 7 1 5 NOISE FLOOR CHANNEL ISOLATION 10 1 6 ACCURACY OF IMPEDANCE CALIBRATION 12 1 7 QUICK CHECK OF ATTENUATORS 14 1 8 CHECK OF ATTENUATOR CORRECTION 16 1 9 QUICK CHECK OF AC COUPLING CAP...

Page 2: ...the measurements described in this document are executed If you do not have a manual at hand you can download it at https www omicron lab com downloads vector network analysis bode 100 1 1 Test of out...

Page 3: ...gnal shape measurement settings Figure 4 test signal shape start continuous measurement Expected Measurement result Figure 5 test signal shape expected result Waveform sinusoidal Vpeak peak 1 26 Volts...

Page 4: ...Measurement Solutions Smart Measurement Solutions 1 2 Accuracy of output frequency Measurement Setup Please connect the output of the Bode 100 to a frequency counter which is locked to a high stable...

Page 5: ...surement type setting Figure 8 output frequency accuracy measurement setting Figure 9 output frequency accuracy start continuous measurement Expected Measurement result Measured frequency 10 MHz Maxim...

Page 6: ...Figure 10 output level accuracy connection setup Equipment Setup Please select the measurement type Gain Phase select the source settings as follows and start a continuous measurement Frequency 1 MHz...

Page 7: ...Bode 100 R2 If you measure a higher power deviation please send in the Bode 100 for calibration adjustment 1 4 Accuracy of Gain Phase factory calibration Measurement Setup Connect the Source of Bode 1...

Page 8: ...Figure 17 gain phase accuracy hardware setup Figure 18 gain phase accuracy measurement settings Then start a single measurement Figure 19 gain phase accuracy start single sweep For better visibility c...

Page 9: ...ed Measurement results Gain 0 dB Tolerance max 0 2 dB from 1 Hz to 50 MHz Phase 0 Tolerance max 3 from 1 Hz to 50 MHz If you measure a higher gain phase deviation please send in the Bode 100 for calib...

Page 10: ...ase accuracy phase measurement 1 5 Noise floor Channel isolation Measurement Setup Disconnect all BNC cables from Bode 100 Do not connect anything to the front side BNC connectors Equipment Setup Plea...

Page 11: ...se floor isolation measurement trace settings After that start a single measurement Figure 26 dynamic range isolation start single sweep Expected Measurement results Gain max 100 dB for 1 Hz to 50 MHz...

Page 12: ...urement Solutions 1 6 Accuracy of impedance calibration Measurement Setup Connect the 50 BNC Load connector to the output of the Bode 100 Figure 28 impedance accuracy connection setup Equipment Setup...

Page 13: ...curacy measurement trace settings Expected Measurement results Reflection max 35 dB for 1 Hz to 50 MHz Figure 31 impedance accuracy reflection magnitude dB measurement If you measure a higher reflecti...

Page 14: ...n be performed This is just a qualitative check that proves that the attenuators do their job in general Measurement setup Connect the Source of Bode 100 to the two inputs using the cables and the T B...

Page 15: ...ons Smart Measurement Solutions Figure 35 quick check attn measurement settings Expected Measurement results Press the continuous measurement button and check if the results fit the expected results b...

Page 16: ...attenuator correction Measurement setup Connect the Source of Bode 100 to the two inputs using the cables and the T BNC Adapter delivered with Bode 100 Figure 36 test attenuators measurement setup Eq...

Page 17: ...for 1 Hz to 50 MHz Phase 0 Tolerance max 3 for 1 Hz to 50 MHz 10 dB 10 dB 20 dB 20 dB 30 dB 30 dB 40 dB 40 dB 0 dB 10 dB Gain 0dB Tolerance max 0 2 dB for 1 Hz to 50 MHz Phase 0 Tolerance max 4 for 1...

Page 18: ...tched OFF before you connect the DC voltage Otherwise the inputs of the Bode 100 will be destroyed Please use a DC Voltage Supply with low ripple and noise to avoid overload caused by the ripple on th...

Page 19: ...lowing the internal connections from the receivers to the 50 output impedance are tested Additionally the output of the Bode 100 will be checked Measurement Setup OPEN SHORT LOAD 50 Equipment Setup Fi...

Page 20: ...SHORT 20 m typ 10 m 50 m typ 10 m LOAD 50 51 49 typ 50 51 49 typ 50 2 Calibration service ISO9001 Factory Calibration Calibration and adjustment of the Bode 100 is performed in our ISO 9001 2008 certi...

Page 21: ...professionals such as scientists engineers and teachers engaged in the field of electronics It simplifies measurement tasks and provides its customers with more time to focus on their real business O...

Reviews: