Bode 100 User Manual
52
reflection coefficient. The central point of the Smith chart corresponds to the
case when the DUT’s impedance equals the reference resistance and,
consequently, the reflection coefficient is zero.
Additionally, the Smith chart contains circles with constant resistance ( ) and
constant reactance ( ). This diagram format allows an easy "translation" of any
point of the reflection coefficient curve into the corresponding DUT’s impedance.
The cursor values displayed in the Smith chart format are the real and imaginary
components of the corresponding DUT’s impedance. For more information on
the Smith chart, refer to the relevant technical literature.
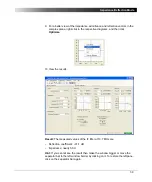
15.In the lower graph you see the Smith chart showing the reflection coefficient
of the quartz filter. To display only this chart, clear the
Trace 1
check box to
deactivate trace 1.
R
X
Summary of Contents for Bode 100
Page 1: ...Bode 100 User Manual...
Page 6: ...Bode 100 User Manual 6 This page intentionally left blank...
Page 12: ...Bode 100 User Manual 12 This page intentionally left blank...
Page 14: ...Bode 100 User Manual 14 This page intentionally left blank...
Page 72: ...Bode 100 User Manual 72 This page intentionally left blank...
Page 81: ...81 Advanced Functions Figure 7 12 Measured curve with sweep settings copied from the zoom area...
Page 98: ...Bode 100 User Manual 98 This page intentionally left blank...
Page 100: ...Bode 100 User Manual 100 This page intentionally left blank...
Page 104: ...Bode 100 User Manual 104 This page intentionally left blank...


