


SYSTEM-10 BTU METER
ONICON Incorporated 727.447.6140
Page 34 onicon.com
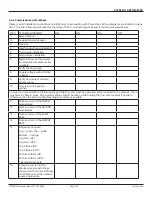
8.
Confirm correct supply
voltage.
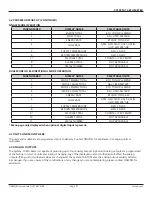
Verify that correct AC voltage is available at the power supply input terminals.
System-10 BTU Meters are configured to operate from 24, 120 or 240 VAC input
voltage (not field selectable).
Input voltages should be within the following ranges:
24 VAC: 20 - 28 VAC, 50/60 Hz, 12VA
120 VAC: 108 - 132 VAC, 50/60 Hz, 15 VA
240 VAC: 207 - 253 VAC, 50/60 Hz, 15 VA
9.
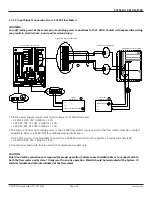
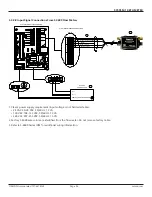
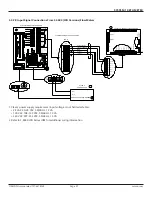
Verify flow meter and
temp sensor wiring
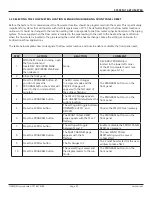
Verify that the flow meter and temperature sensors are properly connected to the
BTU meter. Consult the wiring diagram for your specific flow meter in the System-10
Installation Manual.
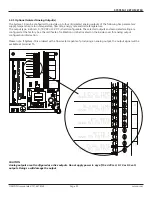
10.
Verify that the flow test
switch is in the RUN
position.
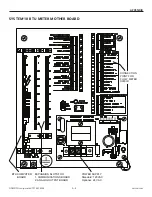
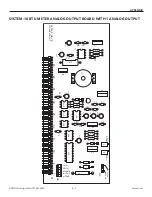
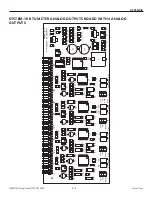
Confirm that the flow test switch is in the correct position. The flow test switch is
located in the middle of the motherboard immediately above the power supply
board. The switch must be set to RUN for normal operation.
In order to proceed with the following steps, the BTU meter must be operating and connected to the network. There
must also be flow in pipes. Flow signal readings should be taken while holding the flow rate constant if possible.
Otherwise, take the various output readings as quickly as possible.
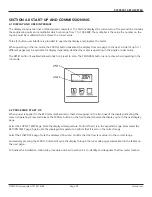
11.
Select the SUPPLY TEMP
page. Note and record
the temperature.
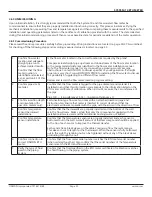
Scroll through the BTU meter display pages and select the SUPPLY TEMP page.
Note the displayed temperature and confirm that it is close to the design supply
temperature specified on the BTU meter certificate of calibration.
Record the temperature.
12. Select the RETURN
TEMP page. Note and
record the temperature.
Scroll through the BTU meter display pages and select the RETURN TEMP page.
Note the displayed temperature and confirm that it is close to the design return
temperature specified on the BTU meter certificate of calibration. Record the
temperature.
13.
Select the FLOW RATE
page. Note and record
the flow reading.
Scroll through the BTU meter display pages and select the FLOW RATE page. Note
the displayed flow rate and confirm that it is within the expected range specified on
the BTU meter certificate of calibration. Record the flow rate.
14 Note and record the
ENERGY RATE.
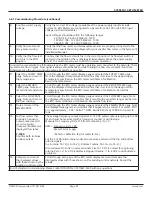
Scroll through the BTU meter display pages and select the ENERGY RATE page. Note
the displayed energy rate and confirm that it appears to be correct. For water, BTU/
hr is approximately = 500 * Delta-T * GPM. Divide BTU/hr by 12,000 to convert to
tons.
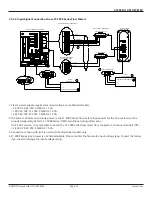
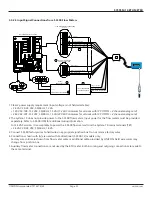
15.
For flow meters that
provide a frequency
output, measure and
record output(s).
Compare calculated vs.
displayed flow rates.
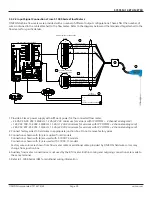
F-1200
Confirm both turbines
produce pulses.
The average frequency output signal is a 0-15 VDC pulsed output ranging up to 200
Hz and must be measured with a frequency counter or oscilloscope.
Measure DC Frequency (Hz) at T4 from terminal 6(+) to 7(-).
GPM = Frequency in Hz x 60
Meter Factor in ppg.
(Refer to calibration tag for meter factor.)
For the F-1200 dual turbine model, also measure and record the top and bottom
turbine signals.
Top Turbine: T4-12(+) to T4-2(-). Bottom Turbine: T4-13(+) to T4-2(-)
Also, measure DC volts on same terminals. Five to 7 VDC is normal for a spinning
turbine. Zero or 14+ VDC indicates a stopped turbine. (1 to 4 VDC could indicate a
problem.)
16. Compare and record
the displayed values
with those shown by the
building control system.
Scroll through each page of the BTU meter display menu and compare the
displayed values with those shown on the building control network. Record the
results.
End of standard commissioning. Please contact ONICON at (727)447-6140 with any questions.
4.6.1 Commissioning Procedure (continued)


