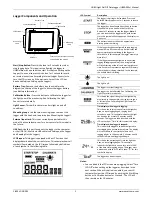
HOBO Light On/Off Data Logger (UX90-002x) Manual
1-800-LOGGERS 3
www.onsetcomp.com
•
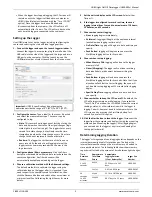
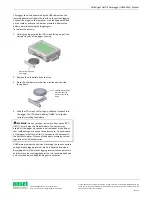
When the logger has stopped logging, the LCD screen will
remain on until the logger is offloaded to a computer or
HOBO U-Shuttle (unless launched with the “Turn LCD Off”
option). Once the logger has been offloaded and
disconnected from the computer, the LCD will turn off
automatically after 2 hours. The LCD will turn back on the
next time the logger is connected to the computer.
Setting up the Logger
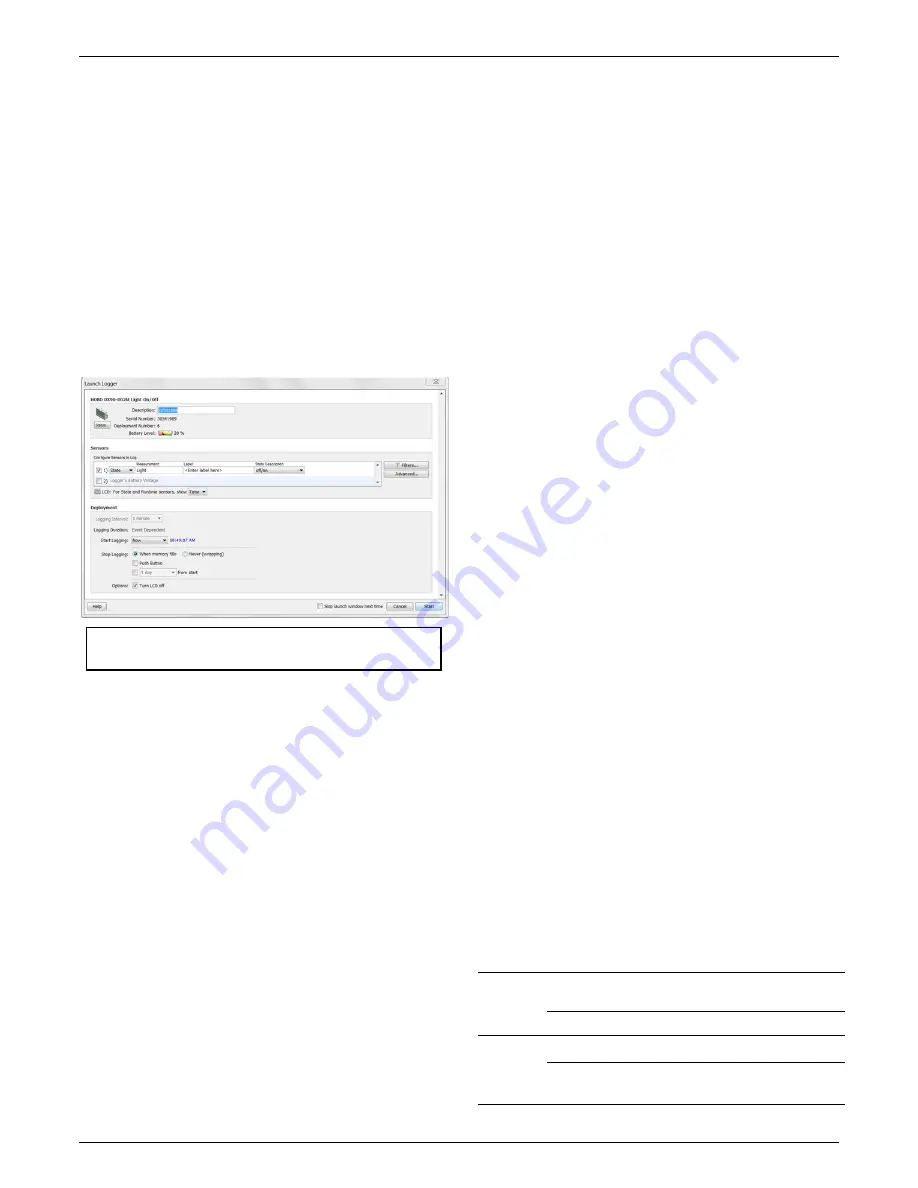
Use HOBOware to set up the logger, including configuring the
sensor and selecting the start and stop logging options.
1.
Connect the logger and open the Launch Logger window
. To
connect the logger to a computer, plug the small end of the
USB cable into the side of the logger and the large end into a
USB port on the computer. Click the Launch icon on the
HOBOware toolbar or select Launch from the Device menu.
Important:
USB 2.0 specifications do not guarantee
operation outside the range of 0°C (32°F) to 50°C (122°F).
2.
Configure the sensor.
Type a label for the sensor if desired
and select the measurement type. The sensor can be
configured to log:
•
State.
This records how long an event lasts by storing the
date and time when the state of the signal changes (logic
state high to low or low to high). The logger checks every
second for a state change, but will only record a time-
stamped value when the state change occurs. One state
change to the next represents the event duration.
•
Runtime.
The logger checks the state of the line once
every second. At the end of each logging interval, the
logger records how many seconds the line was in the
logic low state.
3.
Configure optional filters as necessary.
Click the Filters
button to create additional filtered data series based on the
sensor configuration. Any filtered series will be
automatically available upon reading out the logger.
4.
Choose a calibration method with the Advanced settings.
The default method is to calibrate the logger using the
calibrate button on the logger after it is launched. If you
need to specify the sensitivity used for calibration, then
click the Advanced button and select either a maximum or
minimum level. See
Calibrating the Light Sensor
for more
details.
5.
Set the units to display on the LCD screen.
Select either
Time or %.
6.
If the logger is configured to record runtime, choose a
logging interval from 1 second to a maximum of 18 hours,
12 minutes, and 15 seconds.
7.
Choose when to start logging:
•
Now.
Logging begins immediately.
•
At Interval.
Logging will begin at the next even interval
(available when logging runtime only).
•
On Date/Time.
Logging will begin at a date and time you
specify.
•
Push Button.
Logging will begin once you press the
Start/Stop logging button for 3 seconds.
8.
Choose when to stop logging:
•
When Memory Fills.
Logging will end once the logger
memory is full.
•
Never (Wrapping).
The logger will continue recording
data indefinitely, with newest data overwriting the
oldest.
•
Push Button.
Logging will end once you press the
Start/Stop logging button for 3 seconds. Note that if you
also choose Push Button to start logging, then you will
not be able to stop logging until 5 minutes after logging
begins.
•
Specific Stop Time.
Logging will end at a date and time
you specify.
9.
Choose whether to keep the LCD on or off.
By default, the
LCD will always remain on while logging. If you select the
“Turn LCD off” checkbox, the LCD will not show the current
readings, status, or other information while the logger is
logging. You will, however, be able to temporarily turn the
LCD screen on by pressing the Start/Stop button for 1
second if you select this option.
10.
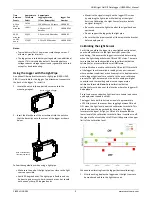
Click the Start button to launch the logger.
Disconnect the
logger from the computer and deploy it using the mounting
materials (see
Mounting the Logger
). After logging begins,
you can read out the logger at any time (see
Reading Out
the Logger
for details).
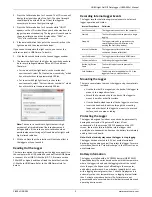
Determining Logging Duration
The logger’s storage capacity and logging duration depends on the
interval between light on/off state changes. The longer the
interval between the changes, the more memory is needed to
store each data point. The following table shows how memory
capacity is affected by the amount of time between light changes:
Time
Between
Events
Approximate
Total Data
Points
Approximate
Logging Duration
(1 Year Battery Life)
Logger Part
Number
1 to 15
seconds
84,650
23.51 hours to 14.7
days
UX90-002
346,795
4.01 to 60.21 days
UX90-002M
16
seconds
to 4.25
minutes
63,488
11.76 to 187.38 days
UX90-002
260,096
48.17 days to 2.1 years
UX90-002M
Distributed by MicroDAQ.com, Ltd. www.MicroDAQ.com (603) 746-5524


