Graphical Displays
StarBright User Manual
60
9.4
Line Graph
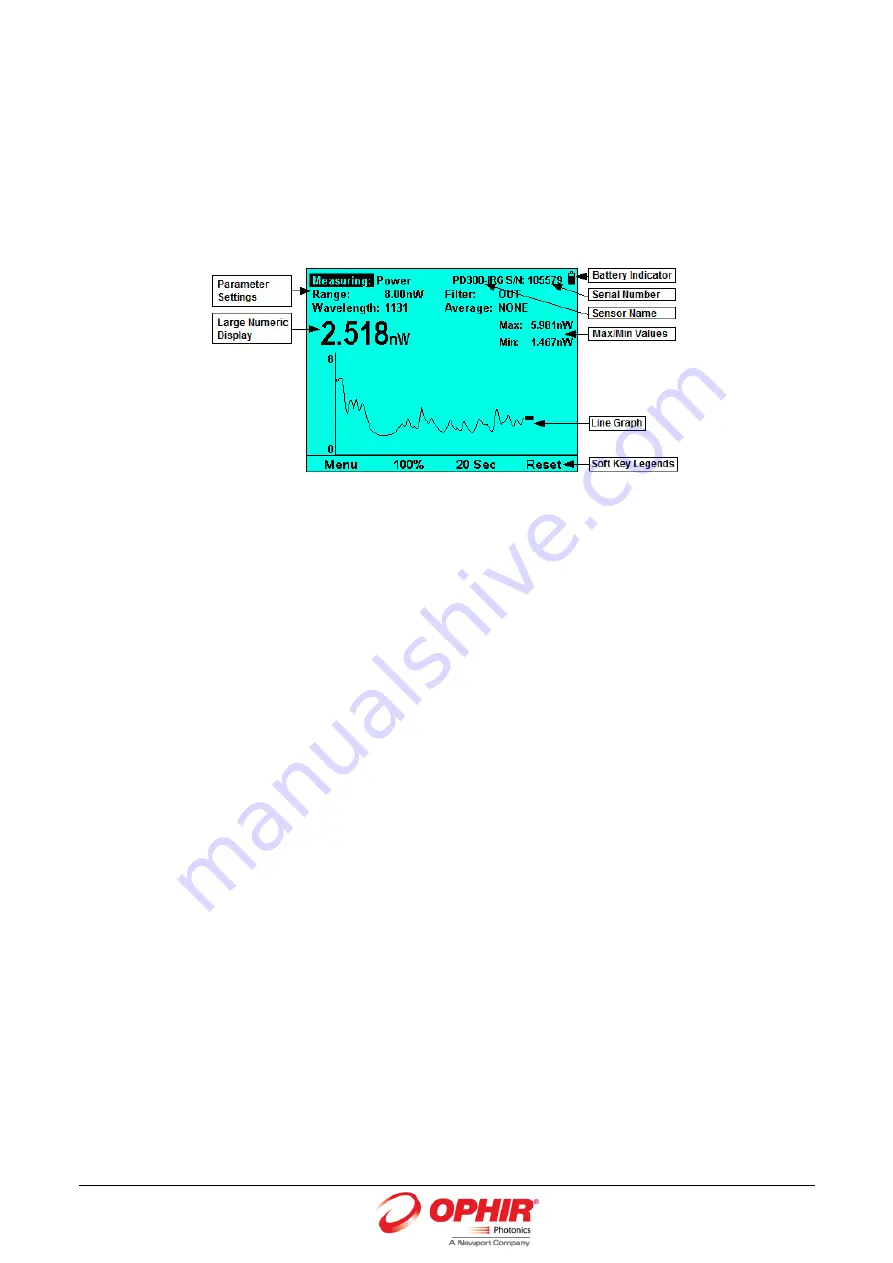
The Line graph displays the laser output as a function of time. This is useful for technicians
performing laser alignment (laser tuning) that want to see the results of their experimenting
graphically as well as to be shown the maximum laser power attained. This graph is time-based
and most applicable when there is a continuous stream of data. The Line graph can be used with
any sensor that measures power or energy.
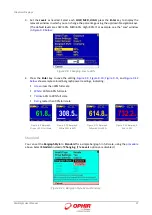
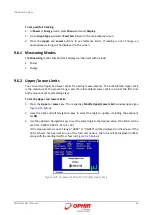
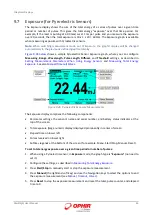
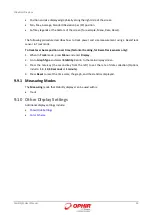
Figure
9-17 Photodiode Power Line Graph
The Line graph display comprises the following components:
Parameter settings, the sensor’s name and serial number, and battery status indicator at the
top of the screen.
Max and Min values on upper right above the Line graph.
Large numeric display above the Line graph.
Line graph displayed prominently in the middle of the screen. The cursor at the tip of the
graphical measurement stream shows where the next reading will be displayed
Soft key legends at the bottom of the screen (for example, Menu, Percentage Range (Y-Axis),
Horizontal Sweep Time (X-Axis), Reset.
To graph laser output over time:
1.
In
Power
or
Energy
mode, press
Menu
and enter
Display
.
2.
Go to
Graph Type
and select
Line
. Return to the main display screen.
3.
Set the percentage range of the scale Line to be displayed to the desired setting.
4.
Set the horizontal sweep (X-Axis) time as necessary.
5.
Press
Reset
to clear the
Min/Max
tracking and to restart the graph.
9.4.1
Measuring Modes
The
Measuring
modes that Line graphs can be used with include:
Power
Energy


