Graphical Displays
StarBright User Manual
58
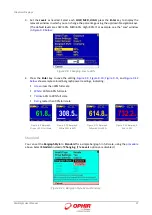
shows “Standard” display results.
Figure
9-14 Standard Display Results
9.3
Analog Needle
The Needle graph simulates an analog display, similar to the style of an analog voltmeter or a car’s
speedometer. By making use of the persistence feature, you can know what the full range of
measurements actually is, including the maximum and minimum readings of the present set of
measurements.
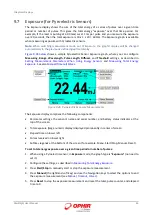
Figure
9-15 Pyroelectric Energy Needle Display
The Needle graph display comprises the following components:
Parameter settings, the sensor’s name and serial number, and battery status indicator at the
top of the screen.
Needle graph displayed prominently in the middle of the screen.
Large numeric display.
Soft key legends at the bottom of the screen (for example, Menu, Zoom, Offset, Persist).


