10 Data Export / PC-Software
26
10.5 Displaying and comparing Measurements
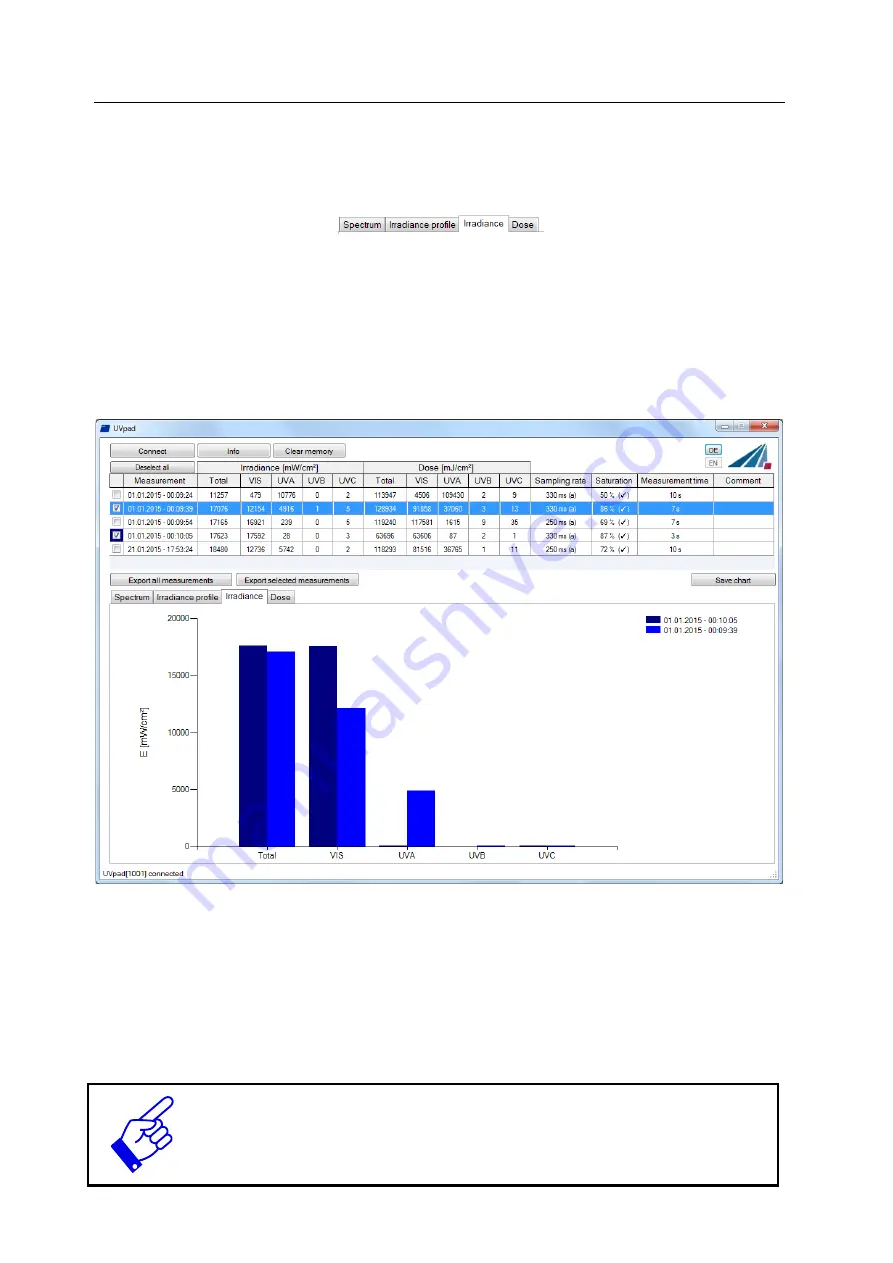
Select the desired display via the tab:
Below is an example with two irradiance measurements.
Up to 10 measurements are selectable at the same time and are labeled in the display area with
date / time.
Each display can be saved via the button “save chart” as an image file (*.jpg, *.bmp, *.tiff,
*.wmf).
10.6 Displaying the Irradiance profile
The irradiance profiles are separately available for all four spectral ranges. For this purpose,
mark the desired measurements and select the desired spectral range on the tab “Irradiance
profile”.
The following example illustrates an irradiance profile for all spectral ranges.
The data logging takes place adjustable between 10 and 250 ms. With shorter
integration times, the maximum irradiance is being saved.
The calculation of the dosage is taken out independently in real time.
Summary of Contents for UVpad E
Page 37: ...15 Notes 37 15 Notes ...


