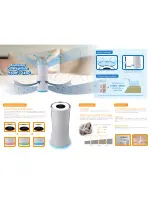
* Space corresponding to a cabin measuring 1.5m (W) x 2.4m (D) x 1.0m (H)
** Testing distance 1m
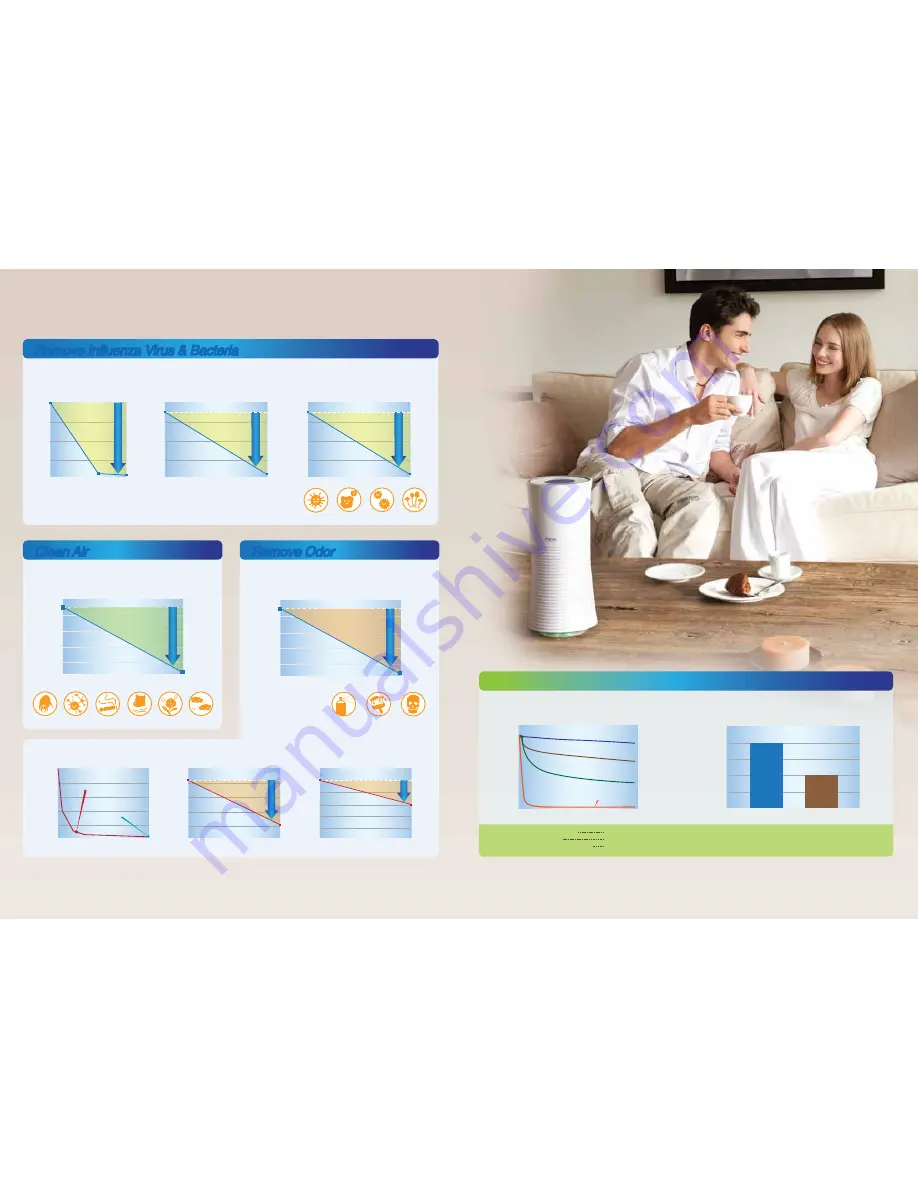
*1 Tested by Biomedical Science Association (BMSA) in Japan. Test method: Influenza viruses (H3N2) was emitted in the air in 120L box and the percentage of Influenza viruses (H3N2) removal was measured.
*2 Tested by SGS. Test method: Airborne Bacteria was emitted in the air in 70x70x70cm box and the percentage of total bacteria removal was measured.
*3 Tested by SGS. Test method: TVOC was emitted in the air in 70x70x70cm box and the percentage of TVOC removal was measured.
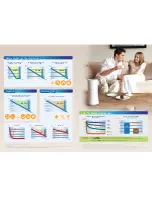
VOC (ppb)
12000
10000
8000
6000
4000
2000
0
10 20 30 40 50 60 70 80 90
Time (mins)
Photo-catalytic Oxidation Technology
16.2%
Efficiency
35.5%
Efficiency
Anion Technology
66.9%
Efficiency
Activated Carbon Technology
99.1%
Efficiency
NCCO Technology
Volatile Organic Compound (VOC)
Reduction*
5
NCCO vs Activated Carbon
Under High Humidity Levels
(at 90% relative humidity)
100
80
60
40
20
0
Efficiency %
NCCO
Zeolite Filter
Activated
Carbon
3
X Efficiency
in TVOC Reduction
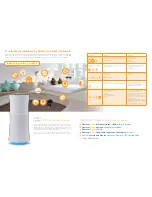
Remove Influenza Virus & Bacteria
Remove Influenza Virus & Bacteria
Clean Air
Clean Air
Remove Odor
Remove Odor
Other filters
in the market
HEPA Filter
Anion
Activated Carbon
Can’t remove any airborne bacteria & produces secondary pollution
Can’t deodorize the pollutants effectively & supply of pollutants exceeds the amount of anions
Fast saturates & stirs up bacteria under high humidity areas
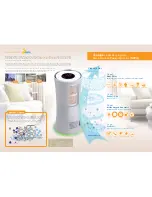
Mold
Dust Mites
Pet Hair
Dust
Pollens
Smoke
Mg/m
3
2.0
1.6
1.2
0.8
0.4
0
60 Mins
Formaldehyde*
7
Remove
72.5%
*
Formaldehyde
in 60mins
Formaldehyde
Acetone
Benzene
Mg/m
3
0.6
0.5
0.4
0.3
0.2
0.1
0
60 Mins
Benzene*
7
Remove
40%
*
Benzene
in 60mins
ppb
10000
8000
6000
4000
2000
0
Acetone*
5
10 20 30 40 50 60 70 80 90 Mins
Remove
90%
Acetone
in 20 mins
Remove
99.1%
Acetone
in 90 mins
Fungi Removal Performance*
6
Candida albicans
60 Mins
<39
99.98%
cfu/m
3
6x10
4
4.5x10
4
3x10
4
1.5x10
4
0
5.1x10
4
15 Mins
5
10
Virus Removal Performance*
1
Influenza viruses - H3N2
PFU
12000
9000
6000
3000
0
6
17
99.95%
Respirable Suspended Particulates (RSP)
Removal Performance*
4
- Smoke
µ
m/m
3
2000
1600
1200
800
400
0
120 Mins
99.72%
1800
5
TVOC Removal Performance*
3
120 Mins
99.52%
13000
62
14000
12000
10000
8000
6000
4000
2000
0
ppb
Filter Technology Comparison
Germ
Bacteria
Virus
*4 Tested by SGS. Test method: RSP was emitted in the air in 70x70x70cm box and the percentage of RSP removal was measured.
*5 Tested by RHT Limited. Test method: Acetone was emitted in the air in 1m
3
box and the percentage of VOC removal was measured.
*6 Tested by Guangzhou Industry Microbe Test Center. Test method: Candida albicans was emitted in the air in 1m
3
box and the percentage of Candida albicans removal was measured.
*7 Tested by China National Analytical Center Guangzhou. Test method: Formaldehyde and Benzene was emitted in the air in 1m
3
box and the percentage of Formaldehyde and Benzene removal was measured.
*8 Tested by Guangdong Detection Center of Microbiology. Test method: Bacteria was suspended in the air in 1m
3
box and the percentage of airborne bacteria sterilized was measured.
Fungi
Bacteria Removal Performance
*
8
Staphylococcus albus
60 Mins
<1
99.99%
cfu/m
3
4x10
5
3x10
5
2x10
5
1x10
5
0
3.63x10
5

