


28
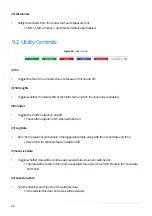
(IX) Secondary Voltage
•
Set the voltage in volts to be output by the SMU not selected in the Voltage Source field.
I. This can be set between -10 V and +10 V.
II. If the voltage is set to 0 V, the secondary SMU will not be used.
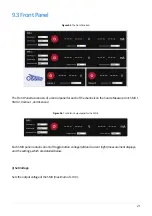
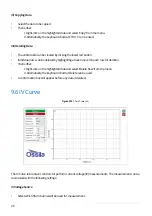
There are 2 buttons to the left of the plot, these allow for data to saved and the plot to be cleared.
(I) Saving Data
•
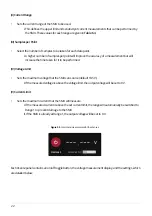
Data in the plot can be saved by clicking the green save button to the right of the plot.
•
This opens a dialog box to navigate to the desired save directory and name the file.
I. The desired file type (comma separated value (.csv) or text (.txt)) can be selected using the
drop-down box to the right of the file name field.
(II) Clear Plot
•
The plot can be cleared of all data by clicking the red delete button to the right of the plot.
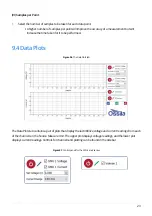
(III) Graph Display Controls
By default, the plots will automatically scale the axes of the graph to display all the data within it. The view can
be controlled manually using the following mouse controls:
•
Left/Middle click and drag – pan the axes.
•
Right click and drag – scale the axes.
•
Scroll wheel – scale the axes.
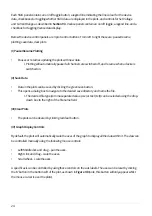
A specific axis can be controlled by using these controls on the axis labels. The axes can be reset by clicking
the ‘A’ button in the bottom-left of the plot, as shown in
Figure 9.11
(note, this button will only appear whilst
the mouse cursor is over the plots).


