32
+*
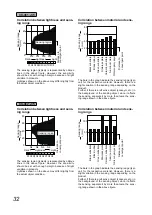
Correlation between lightness and sens-
ing range
40
20
0
Sensing range
L
(mm)
Lightness
Light
Dark
N2
N4
N6
N8
N1 N2
N4
N3
N6
N5
N8 N9
N7
Sensing region
Distance to
convergent point
The sensing region (typical) is represented by oblique
! E " Q A+ E
should be set with enough margin because of slight
variation in products.
Lightness shown on the above may differ slightly from
E! "
Correlation between material and sens-
ing range
40
60
80
20
0
Black substrate
Black rubber
Green substrate
Stainless plate
Ceramic substrate
White non-glossy paper
Aluminum plate
Sensing range
L
(mm)
Distance to
convergent point
The bars in the graph indicate the sensing range (typi-
! E '!" Q A+ E
slight variation in the sensing range depending on the
product.
;E+E +"
E X E +
E+' EAE-
E AE H"
+"*
Correlation between lightness and sens-
ing range
Sensing range
L
(mm)
Lightness
Light
Dark
Sensing region
Distance to
convergent point
80
60
40
20
0
N2
N4
N6
N8
N1 N2
N4
N3
N6
N5
N8 N9
N7
The sensing region (typical) is represented by oblique
! E " Q A+ E
should be set with enough margin because of slight
variation in products.
Lightness shown on the above may differ slightly from
E! "
Correlation between material and sens-
ing range
Black substrate
Black rubber
Green substrate
Stainless plate
Ceramic substrate
White non-glossy paper
Aluminum plate
100
50
0
Sensing range
L
(mm)
Distance to
convergent point
The bars in the graph indicate the sensing range (typi-
! E '!" Q A+ E
slight variation in the sensing range depending on the
product.
;E+E +"
E X E +
E+' EAE-
E AE H"


