38
VQT1C63
Advanced-Shooting
■
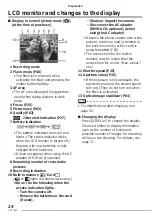
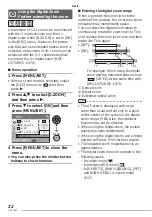
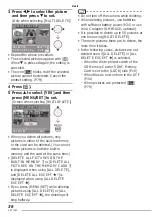
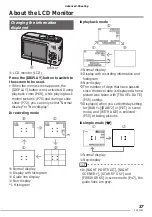
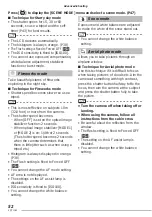
About guide line display
When you align the subject on the guide
lines or the cross point of these lines,
you can take pictures with well-designed
composition by viewing the size, the slope
and the balance of the subject.
■
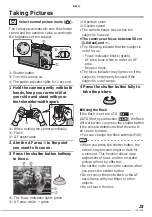
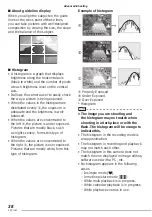
Histogram
• A histogram is a graph that displays
brightness along the horizontal axis
(black to white) and the number of pixels
at each brightness level on the vertical
axis.
• It allows the camera user to easily check
the way a picture is being exposed.
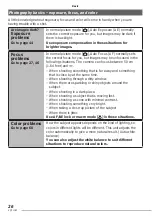
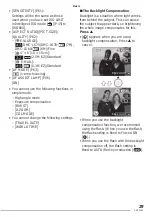
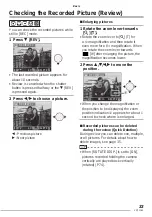
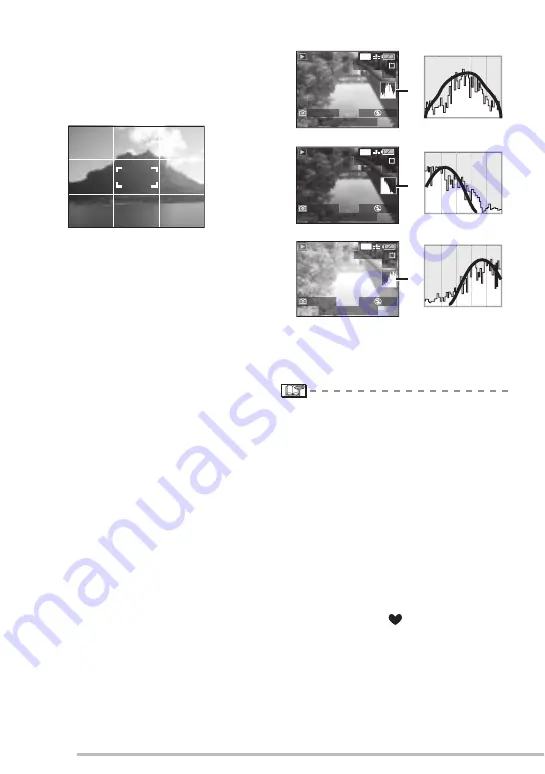
• When the values in the histogram are
distributed evenly
A
, the exposure is
adequate and the brightness is well-
balanced.
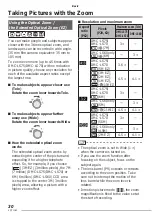
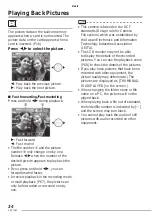
• When the values are concentrated to
the left
B
, the picture is under exposed.
Pictures that are mostly black, such
as night scenery, forms this type of
histogram.
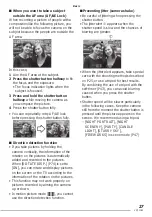
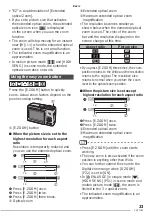
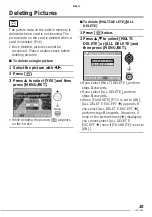
• When the values are concentrated to
the right
C
, the picture is over exposed.
Pictures that are mostly white, form this
type of histogram.
Example of histogram
A
Properly Exposed
B
Under Exposed
C
Over Exposed
* Histogram
• The image you are shooting and
the histogram may not match when
shooting in a dark place or with the
fl ash. The histogram will be orange to
indicate this.
• The histogram in the recording mode is
an approximation.
• The histogram in recording and playback
may not match each other.
• The histogram in this camera does not
match the one displayed in image editing
software used with a PC, etc.
• No histogram appears in the following
cases.
– In simple mode [
].
– In motion picture mode [
i
].
– While multi playback is in progress.
– While calendar playback is in progress.
– While playback zoom is in use.
F2.8 1/100
200
ISO
AWB
F2.8 1/200
200
ISO
AWB
F2.8 1/50
200
ISO
AWB
*
*
*
100-0001
1/19
100-0001
1/19
100-0001
1/19
7
M
7
M
7
M
A
B
C
.
.
:
.
.
:
.
.
:
10 00 JAN 1 2007
10 00 JAN 1 2007
10 00 JAN 1 2007

