
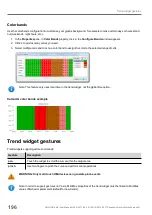
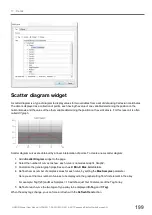


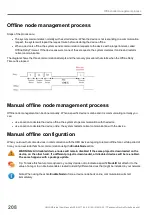
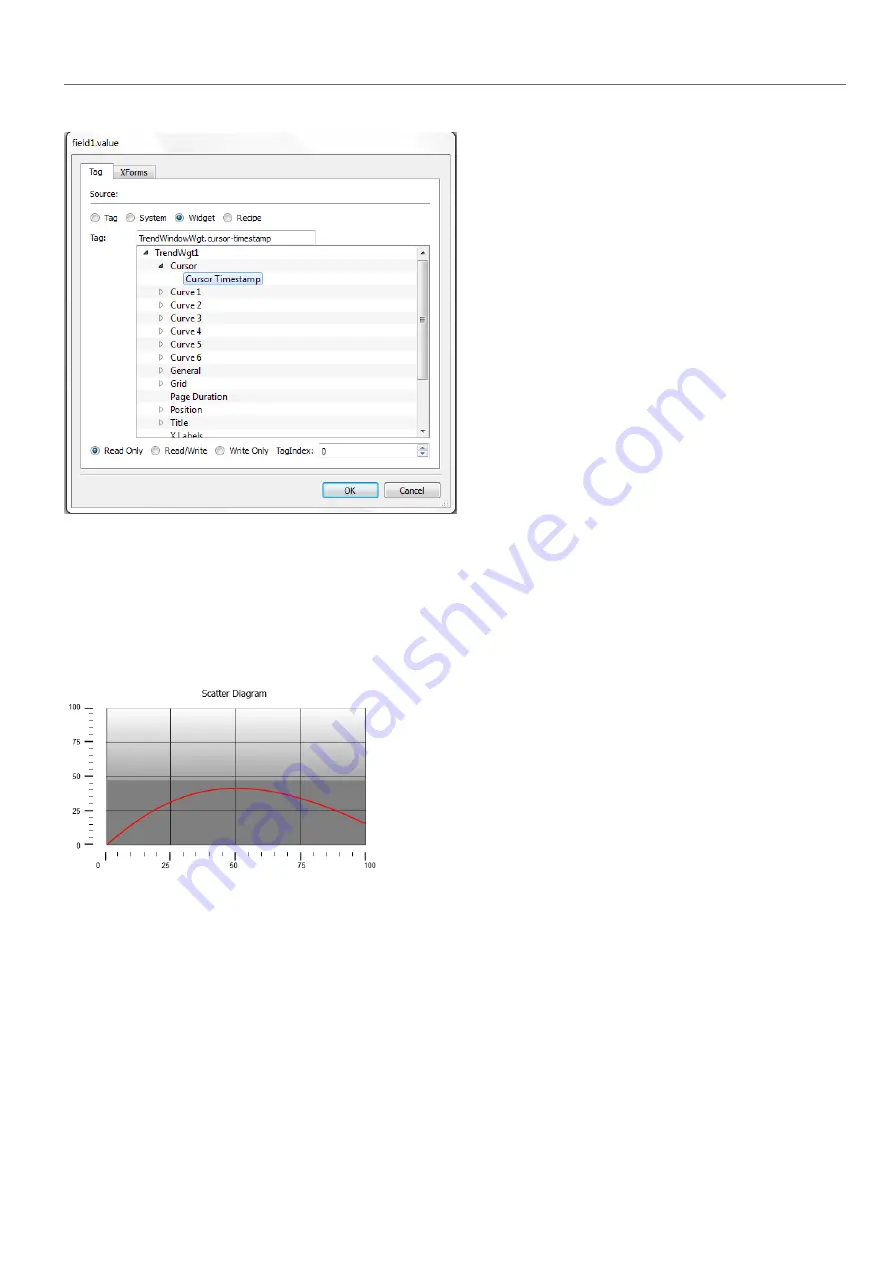
Scatter diagram widget
A scatter diagram is a type of diagram to display values for two variables from a set of data using Cartesian coordinates.
The data is displayed as a collection of points, each having the value of one variable determining the position on the
horizontal axis and the value of the other variable determining the position on the vertical axis. For this reason it is often
called
XY graph
.
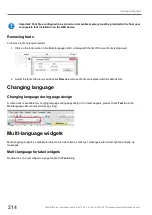
Scatter diagram curves are obtained by a linear interpolation of points. To create a new scatter diagram:
1. Add a
Scatter Diagram
widget to the page.
2. Select the number of curves to show: each curve is named as Graph1, Graph2,...
3. Customize the general graph properties such as
X Min
,
X Max
,
Grid
details.
4. Define the max number of samples/values for each curve by setting the
Max Samples
parameter.
Here you set the max number of values to be displayed in the graph starting from first element in the array.
For example: Tag1[20] and Max Samples = 10 will show just first 10 elements of the Tag1 array.
5. Define for each curve the two tags of type array to be displayed (
X-Tag
and
Y-Tag
).
When the array tags change, you can force a refresh with the
RefreshTrend
action .
HMWIN Studio | User Manual | v206 (2017-06-30) | EN | © 2014-2017 Panasonic Electric Works Europe AG
199
17 Trends
Summary of Contents for HMWIN
Page 166: ...164 HMWIN Studio User Manual v206 2017 06 30 EN 2014 2017 Panasonic Electric Works Europe AG ...
Page 258: ...256 HMWIN Studio User Manual v206 2017 06 30 EN 2014 2017 Panasonic Electric Works Europe AG ...
Page 380: ...378 HMWIN Studio User Manual v206 2017 06 30 EN 2014 2017 Panasonic Electric Works Europe AG ...
Page 439: ......