Paramount User Guide
147
|
P a g e
“doubling” of the periodic error. So, if the periodic error is higher after applying PEC,
chances are this is the cause. Simply turn off the check box, and proceed with the
next step.
7.
Click the
Fit
button. The
PEC Table
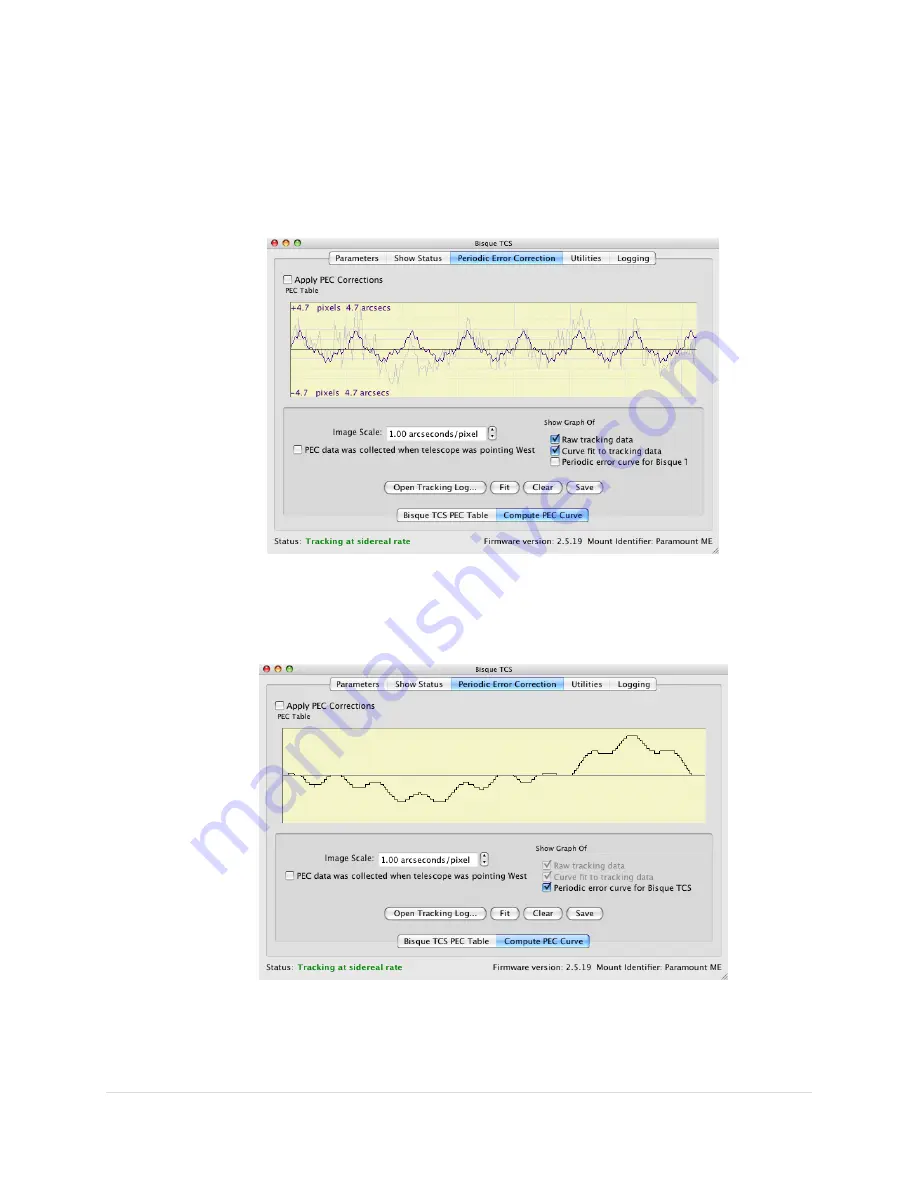
graph is updated with the optimal periodic error
curve for your mount.
Figure 78: After clicking the Fit button, the graphs show both the raw and “fitted” data.
8.
Click the
Periodic Error Curve for Bisque TCS
checkbox to display the graph of the
curve that will be transferred to the Paramount control system's PEC table.
Figure 79: This periodic error curve should be saved to the mount's PEC table.
The above PEC curve is not "smooth" by design. The graph shows the minimum resolution
for mount "moves" (approximately 0.01 arcseconds) when applying periodic error


