20 G r a p h
When the Linear Fit is turned on, the special option Create Calculation from Lin-
ear Fit appears in the Tools menu (see page 22).
Linear Fit can be useful even when the graphed data are not linear (qua-
dratic or exponential, for instance). See “Graph Linearization” on page 47.
Area Tool
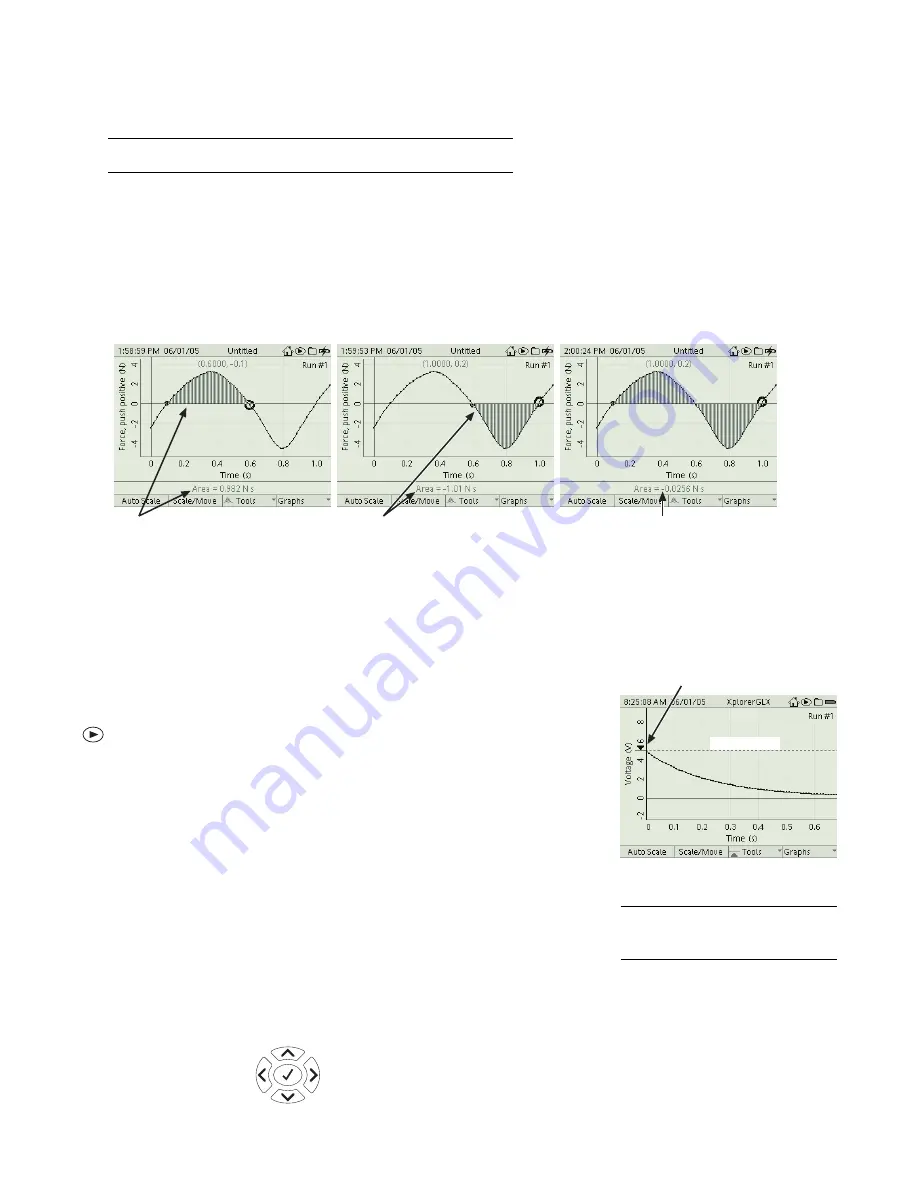
Select the Area Tool from the Tools menu to measure the area
between the data plot and the X-axis in the ROI. (See “Statistics” above for
instructions on setting the ROI.)
For data plotted below the X-axis, the area is measured as negative. The value of
area displayed at the bottom of the screen is the total area above the X-axis minus
the total area below the X-axis.
Area Tool
Derivative
This tool overlays a graphical representation of the derivative (or
rate of change) of the data. In some cases, the Graph may need to be rescaled in
order to see the overlaid derivative. The Derivative Tool is designed for titration
experiments in which it is necessary to identify a point in a data set at which the
maximum rate of change occurs.
Trigger
The Trigger is a tool that allows you to control how the GLX collects
data. With the Trigger, you make the GLX delay data recording (after you press
) until a certain condition is met by the incoming data. The Trigger has two
parameters: Trigger Edge, which can be rising or falling, and Trigger Level,
which specifies the data value that must be crossed. For example, on a voltage
versus time graph, if you set the Trigger Edge to rising and the Trigger Level to 5
volts, data recording will not start until the measured voltage rises above 5 volts.
The Trigger can be used in normal graph mode to start continuous recording, or it
can be used in Scope Mode (see page 22) to repeatedly trigger bursts of data col-
lection. In both modes, the Graph must have time on the horizontal axis.
To turn on the Trigger, select it from the Tools menu.
A horizontal dashed line
appears on the Graph indicating the Trigger Level. Press the up and down arrow
keys to change the Trigger Level. Press the right arrow key to cycle through ris-
ing edge, falling edge, and disabled. (The Trigger is initially disabled, so you
must press the right arrow key at least once to enable it.)
Positive
Area
Negative
Area
Total Area is area above the axis minus
area below the axis.
Trigger Level
Arrow Indicating
Trigger Edge
Trigger
5
The Trigger turns on automatically
when you turn on Scope mode. See
page 22.
Increase
Trigger Level
Decrease
Trigger Level
Enable, Disable, and
Change Trigger Edge
Open Trigger
Settings
Summary of Contents for Xplorer GLX
Page 4: ......
Page 6: ......
Page 7: ...Part 1 Users Guide...
Page 8: ......
Page 18: ...12 O v e r v i e w o f t h e G L X...
Page 94: ...88 S e t t i n g s S c r e e n...
Page 98: ...92 P r i n t i n g...
Page 104: ...98 O p e r a t i n g T e m p e r a t u r e...
Page 112: ......
Page 116: ...110 C a l o r i m e t r y...
Page 132: ...126 V o l t a g e v e r s u s R e s i s t a n c e...
Page 136: ...130 I n d u c e d E l e c t r o m o t i v e F o r c e...
Page 146: ...140 B e a t F r e q u e n c y...
Page 150: ......
Page 152: ......


