X p l o r e r G L X U s e r s ’ G u i d e
23
After you press
, the GLX begins collecting and displaying a series of data
bursts (each burst is enough data fill the Graph from left to right). If you have
enabled the Trigger, the GLX waits for the trigger condition to be met before col-
lecting each burst.
While Scope-mode data collection is in progress, you can change the scale of the
Graph (with
Autoscale,
Scale/Move, or the mouse) and you can
change the Trigger settings with the arrow keys.
To stop data collection, press
again. The GLX will save the last-collected
data burst as Run #1 (or #2, #3, #4, etc.). You can also use the Trigger’s Stop
Condition (see page 21) to make the GLX stop automatically after collecting a
single data burst.
You can use Scope Mode in conjunction with Two Measurements mode or
Two Graphs mode (see below) to display two traces simultaneously.
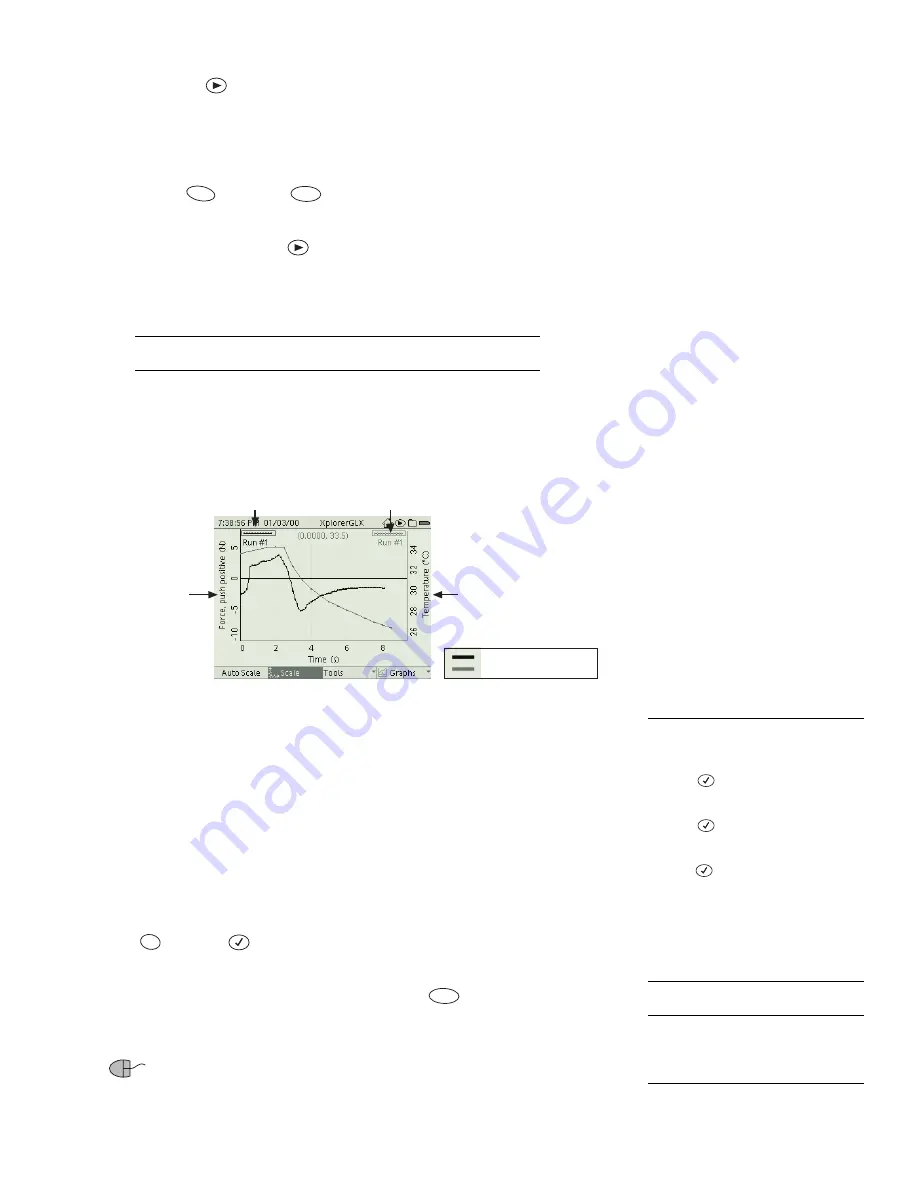
Two Measurements
Select this option from the Graphs menu to put the Graph
into Two Measurements mode. In this mode, two measurements (or data sets) are
graphed simultaneously.
Two Measurements mode
The data source and scale of the First Measurement are displayed on the left side,
and the data source and scale of the Second Measurement is displayed on the
right side. Select either the left or right data source field
to change the corre-
sponding measurement.
The run number of the First Measurement is displayed in the upper left corner of
the Graph, and the run number of the Second Measurement is displayed in the
upper right corner. To change the run number of either measurement, select the
corresponding run number field.
One of the measurements is plotted in black, and the other one in gray. The mea-
surement in black is the active data. To switch activity to the other measurement,
hold
and
press
.
The Data Cursor appears on the active data. If you select a tool from the Tools
menu, it is applied to the active data set. If you press
to scale or move ver-
tically, only the active data will change.
However, moving the Graph horizon-
tally or changing the horizontal scale will affect both sets.
If you are using a mouse, you can switch activity to a measurement by
clicking on the line above its run number. Vertically scale each measurement by
dragging its numeric labels (on the left or right side of the Graph).
F1
F2
Run Number of
First Measurement
(select to change)
Run Number of
Second Measurement
(select to change)
Data Source of
Second Measurement
(select to change)
Data Source of
First Measurement
(select to change)
Active Data (black)
Inactive Data (gray)
11
To select a data source field or run
number field:
Keypad
1. Press
to light up the active fields.
2. Use the arrow keys to move the high-
light to the desired field.
3. Press
again to open the menu.
4. Use the arrow keys to move the high-
light to the desired menu option and
press ;
or
press the number on the
keypad corresponding to the desired
menu option.
Mouse
1. Click the desired field to open the
menu.
2. Click the desired menu option.
Esc
F2
12
The exception to this rule is when both
data sets are of the same units (both
temperature in °C, for instance); in that
case, both data sets scale together.
Summary of Contents for Xplorer GLX
Page 4: ......
Page 6: ......
Page 7: ...Part 1 Users Guide...
Page 8: ......
Page 18: ...12 O v e r v i e w o f t h e G L X...
Page 94: ...88 S e t t i n g s S c r e e n...
Page 98: ...92 P r i n t i n g...
Page 104: ...98 O p e r a t i n g T e m p e r a t u r e...
Page 112: ......
Page 116: ...110 C a l o r i m e t r y...
Page 132: ...126 V o l t a g e v e r s u s R e s i s t a n c e...
Page 136: ...130 I n d u c e d E l e c t r o m o t i v e F o r c e...
Page 146: ...140 B e a t F r e q u e n c y...
Page 150: ......
Page 152: ......


