Viewing a Summary of Alarms
32
FS6300 NMS Getting Started Guide
3 • Configuring Alarms and Clocking
Alarm Indications
The following are symbols that appear on a card or node icon when the NMS receives an alarm:
•
Critical:
Red circle with a white “X”
•
Major:
Yellow circle with two black exclamation points
•
Minor:
Light yellow circle with a single black exclamation point
•
No Alarm/Informational:
Green circle with black checkmark
Alarms are propagated up to the next level throughout the
Network Maps
section in the menu tree.The
Chas-
sis
icon indicates an alarm alert if one or more of the cards have an alarm. On the
Geographical Aera
level, a
network node will also display alarm alerts if a card in a chassis has an alarm.
Viewing a Summary of Alarms
To view a summary of all systems with an alarm, click on
Failed Systems
(under Network Maps) in the menu
tree on the left side of the screen. The Failed Systems map shows all the cards that have alarm alerts.
The
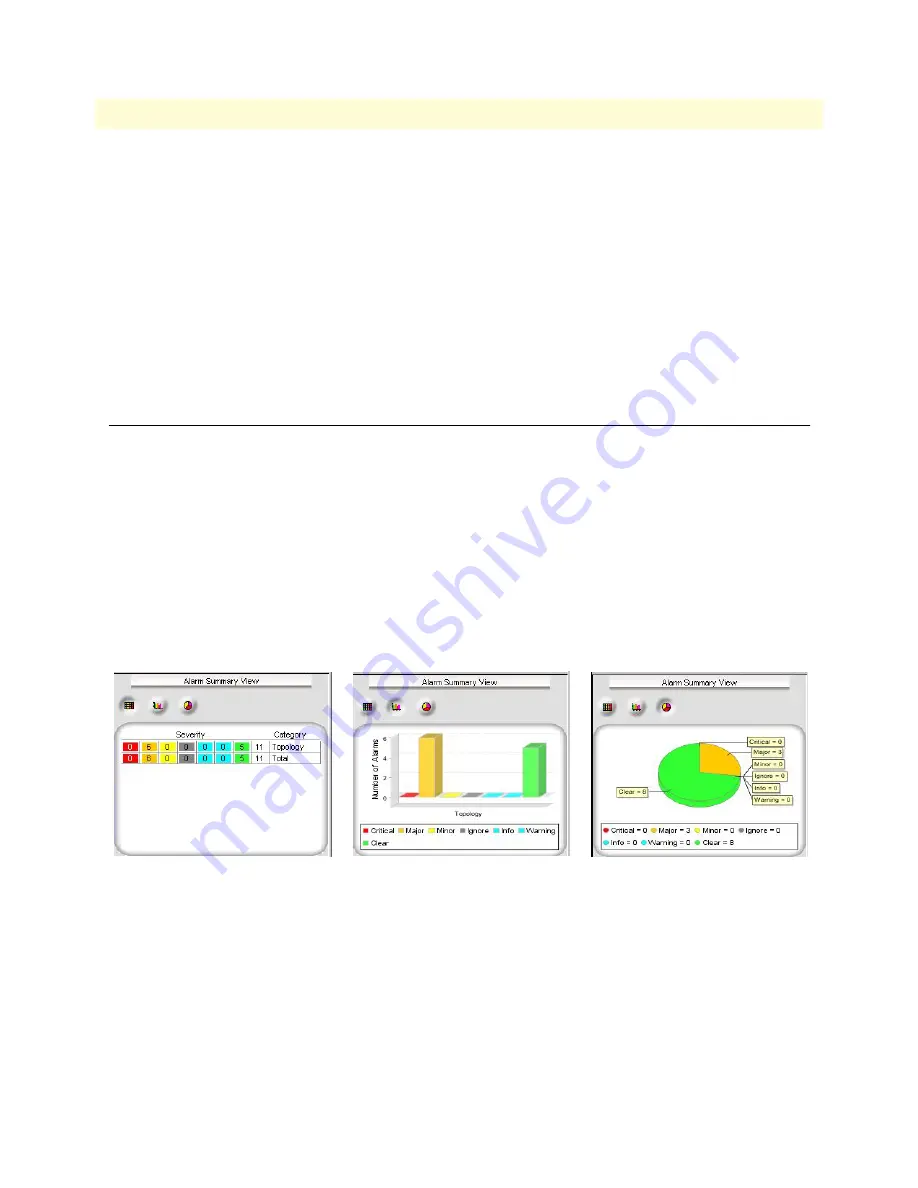
Alarm Summary View
window always appears in the bottom left corner of the screen under the main
menu tree. It offers a quick glance at the status of alarms that are currently occurring in the system. You can
change how the Alarm Summary View is displayed by clicking on the icons in the Alarm Summary View win-
dow. There are three different view options:
•
Tabular View
•
Graphical View
•
Pie Chart View
Figure 12. Alarm Summary View options (Tabular, Graphical, and Pie Chart)


