© PCE Instruments
28
Eng
li
s
h
Set markers
After taking a measurement, you can set markers and compare different measuring points to
each other.
To do so, follow these steps:
1.
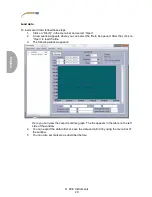
Double-click at any point of the real-time graph.
2.
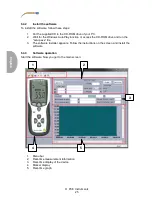
The cursor now transforms into a violet vertical line. Move the line to the measuring
point you want to compare. The measuring value and time appear in the marker
indication (3) at “CursorA”. Left
-click on the measuring point in the graph to select it.
3.
When you have set the first marker the cursor transforms into a green vertical line.
Select the position of the second marker. The measuring value and time appear in the
marker indication (3) at “CursorB”. Left
-click on the measuring point in the graph to
select it.
4.
Once both markers are set, the software shows the MIN/MAX and average values, as
well as the number of measuring points between both markers.
Save data
To save the measured data, follow these steps:
1.
Click on “File(F)” in the menu bar and select “Save as”.
2.
A new window appears where you can set the saving path and file name.
3.
Click on “Save” to save the data at the set location. The data is saved in *.txt format.
Export data to Excel
To export the data to Excel click on “File(F)” and select “Export To Excel(E)”. An Excel f
ile with
the measured data opens automatically.
Print data
To print the measured data, follow these steps:
1.
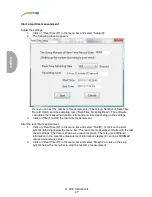
Click on “File(F)” in the menu bar and select “Print Graph(G)” to print out the graph or
select “Print Data(D)” to print out the measured data as t
able.
2.
A new window appears where you can adjust the printing settings.
3.
Click on “OK” to print out the data.

