WaveStar Color Monitor_____________________________________________________________
Ctrl Nr: PM375103 Revision: 003
42
7
Web Pages
The Color Monitor has a web server that can display web pages if the Monitor has a functioning
TCP/IP connection. Touch
Setup
Network/SNMP
to see the
IP Address
used for the web server.
Enter the IP address into the address line of your browser, then
“enter”, to display the start or
Home
page.
A “device” is a points list or Modbus register map that corresponds to a physical device, such as a
panelboard. The following web pages show a PDU with an M4G acquisition board (M4GACK),
subfeeds monitored through the BCMS Enhanced Subfeeds points list, and a Color Monitor.
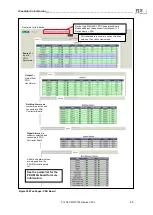
Figure 34 Web Pages: Device Chain
Each web page has three buttons:
•
Click
Home
to return to Color Monitor Home page.
•
Click
PDI
to display the PDI web page.
•
Click
Devices
to display a list of all devices in the Color
Monitor’s downstream chain.
Figure 33 Web Pages: Home Page
This list shows devices
that are in the Monitor’s
device chain.
PDU with Color Monitor:
Device 1 = Color Monitor
Device 2 = PDU Board (M4G)
Device 3 = Group of large PDU
subfeeds (Enhanced Subfeeds)
Click a device line to
bring up the web pages
for the device.
Device Status Summary:
-Green=OK, no alarms
-Yellow=Warning
-Red=Alarm
-Black=Alarms Not Applicable


