QTrace Analyser Overview
QT
RACE
-
U
SER
M
ANUAL
© 2018 PDQLogic Ltd.
QTrace User Manual Rev 1.01
Page 12
2.2.2
Status bar
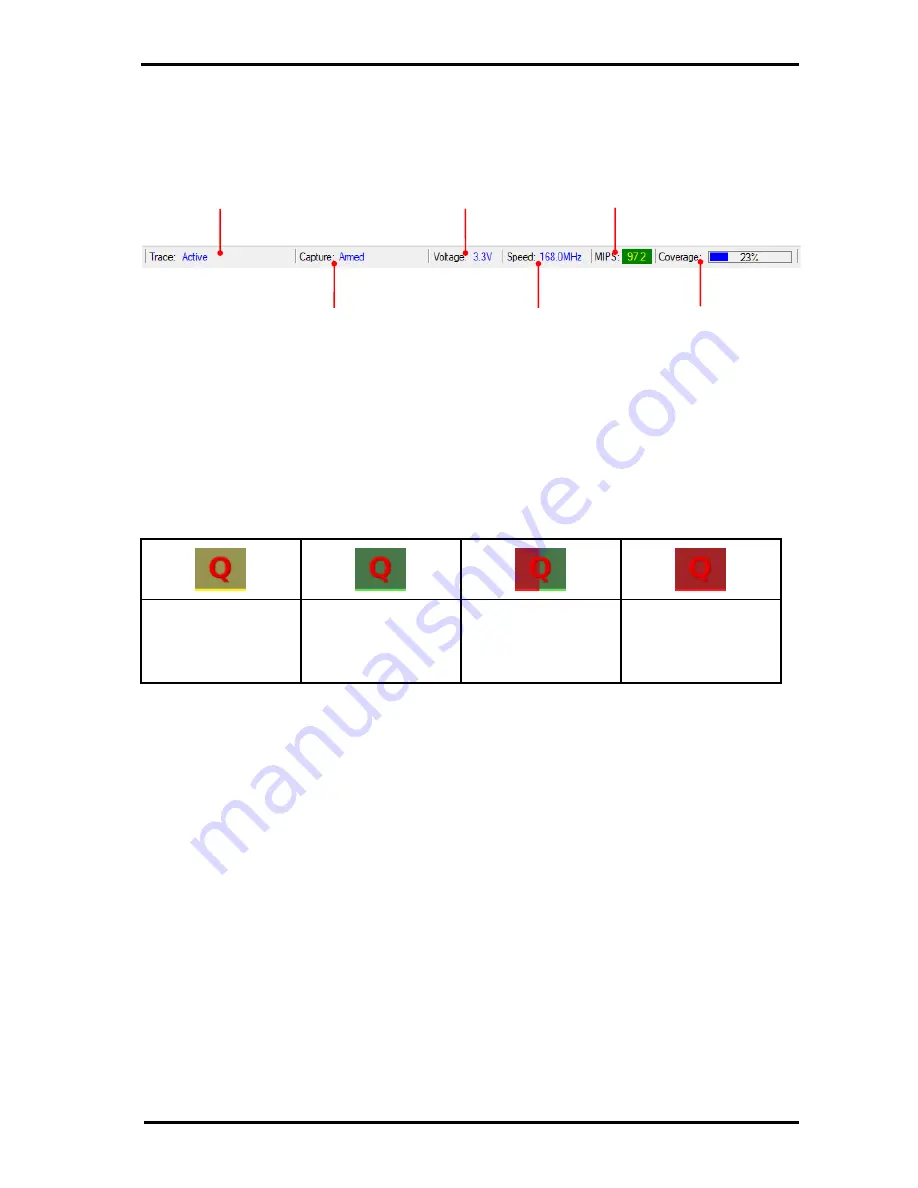
The status bar gives a quick at-at-glance overview of system operation.
Table 5 Status bar feature summary
2.2.2.1
Taskbar icon
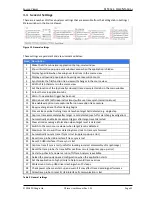
As well as the main status bar, the application icon in the Windows Taskbar is also used to convey
system status. This is useful when the QTrace Analyser is hidden by another application. The following
colours indicate key events:
Yellow
Target reset detected
Green
Tracing is in progress
Green / Red flashing
A trace capture event
occurred
Red
A target exception or a
trace error occurred
Table 6 Taskbar icon states
2.2.3
Trace views
There are three primary trace views which can be selected using the coloured tabs labelled
Trace
view
select
in Figure 5 above. Each gives a different visualisation of target program execution:
1.
Source Viewer
2.
Trace Capture
3.
Profiling
The operation of each trace view is detailed in the following sections.
Trace hardware
interface status
Trace capture
status e.g. disabled,
armed, triggered
Selected target
trace interface
voltage level
Detected CPU clock
speed (useful for PLL
verification)
Average
instruction
rate
Code coverage
overall value


