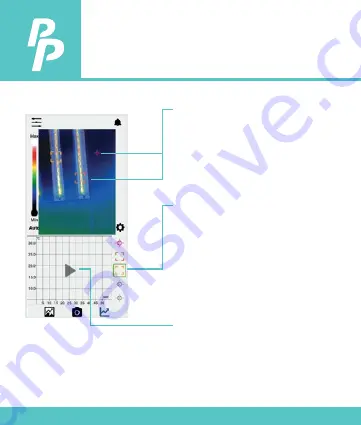
9. Graph
P.13
Target Pixel:
1) Touch to select your target pixel
2) Monitoring the target which
temperature will be shown in
the graph
Legend Menu:
1.) Short press to enable or disable
each curve (Max. five curves can
be monitored)
2) Press and hold to change the
target pixel icon between square
and dot
Play Button:
1) Press once to run or
2) Stop plotting and save the graph
into Gallery


