Pericom Semiconductor Corp.
www.pericom.com
Page 10 of 19
11/5/2013
AN
05/05/04
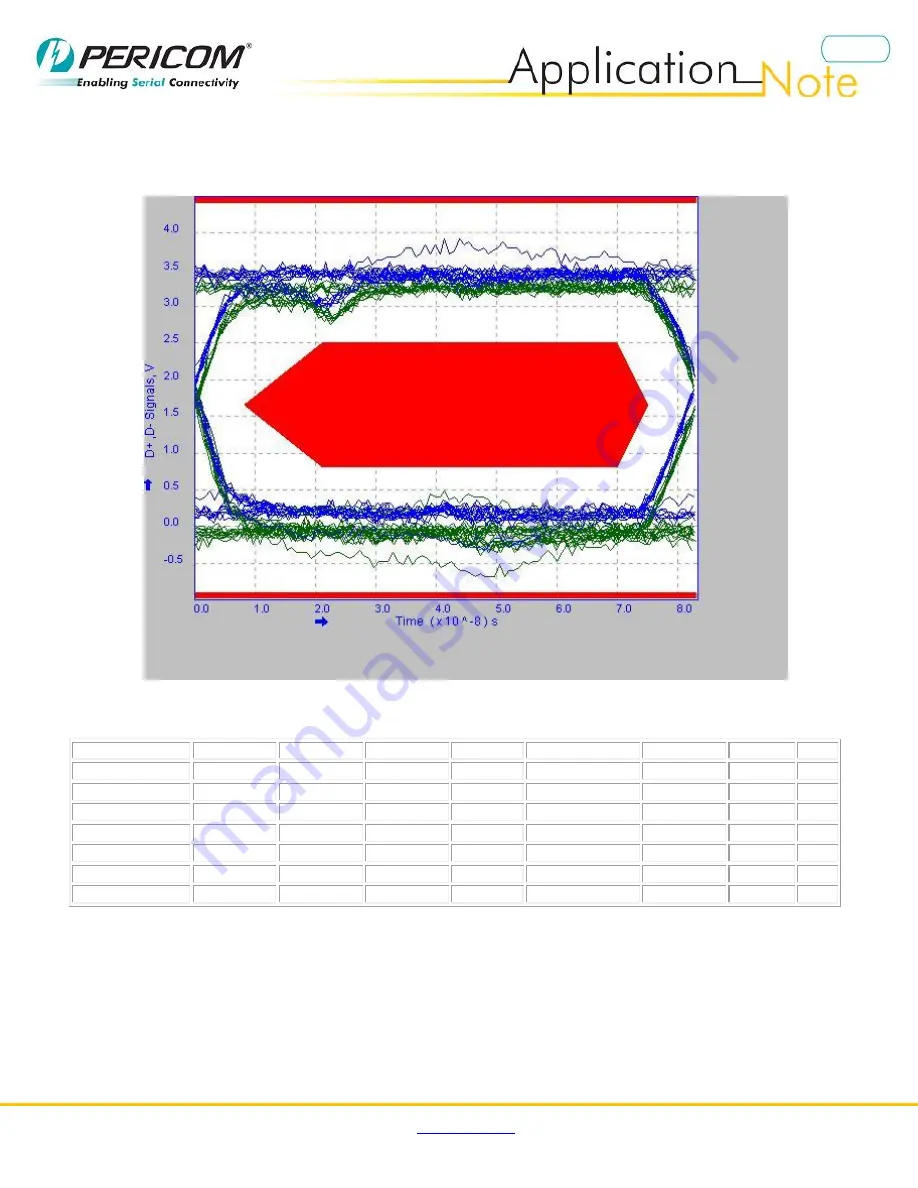
Figure 8a and Figure 8b show the PASSING eye-diagram of which the USB 2.0 Full Speed signal passing through
PI3USB102.
Figure 8a. Full Speed Eye-Diagram of connection to M+/M-
Measurement Name
Minimum
Maximum
Mean
pk-pk
Standard Deviation
RMS
Population
Status
Eye Diagram Test
-
-
-
-
-
-
-
Pass
Signal Rate
11.82033Mbps 12.19512Mbps 11.99872Mbps 0.0000bps
117.2124kbps
12.00201Mbps
30
Pass
Crossover Voltage
1.700000 V
1.960000 V
1.821494 V
260.0000mV
64.66396mV
1.822574 V
17
Pass
EOP Width
-
-
165.8083ns
-
-
-
1
Pass
Consecutive Jitter
-692.1122ps
863.4434ps
0.0000s
1.555556ns
524.1401ps
507.4965ps
16
Pass
Paired JK Jitter
-400.0000ps
276.8254ps
-2.539683ps
676.8254ps
211.5925ps
195.9130ps
7
Pass
Paired KJ Jitter
-204.4444ps
417.7778ps
30.36075ps
622.2222ps
217.9307ps
204.0361ps
7
Pass
Table 5. Full Speed Signal Quality Measurement of connection to M+/M-
Additional Information :
Rise Time: Min: 12.739ns Max: 15.468ns Mean: 13.801ns Std: 781.27ps RMS: 13.820ns Population: 8
Fall Time: Min: 13.362ns Max: 14.530ns Mean: 13.840ns Std: 426.35ps RMS: 13.846ns Population: 8


