31
30
VIEW THE TRAINING SESSION RESULTS
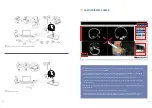
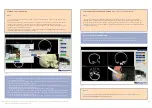
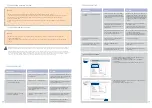
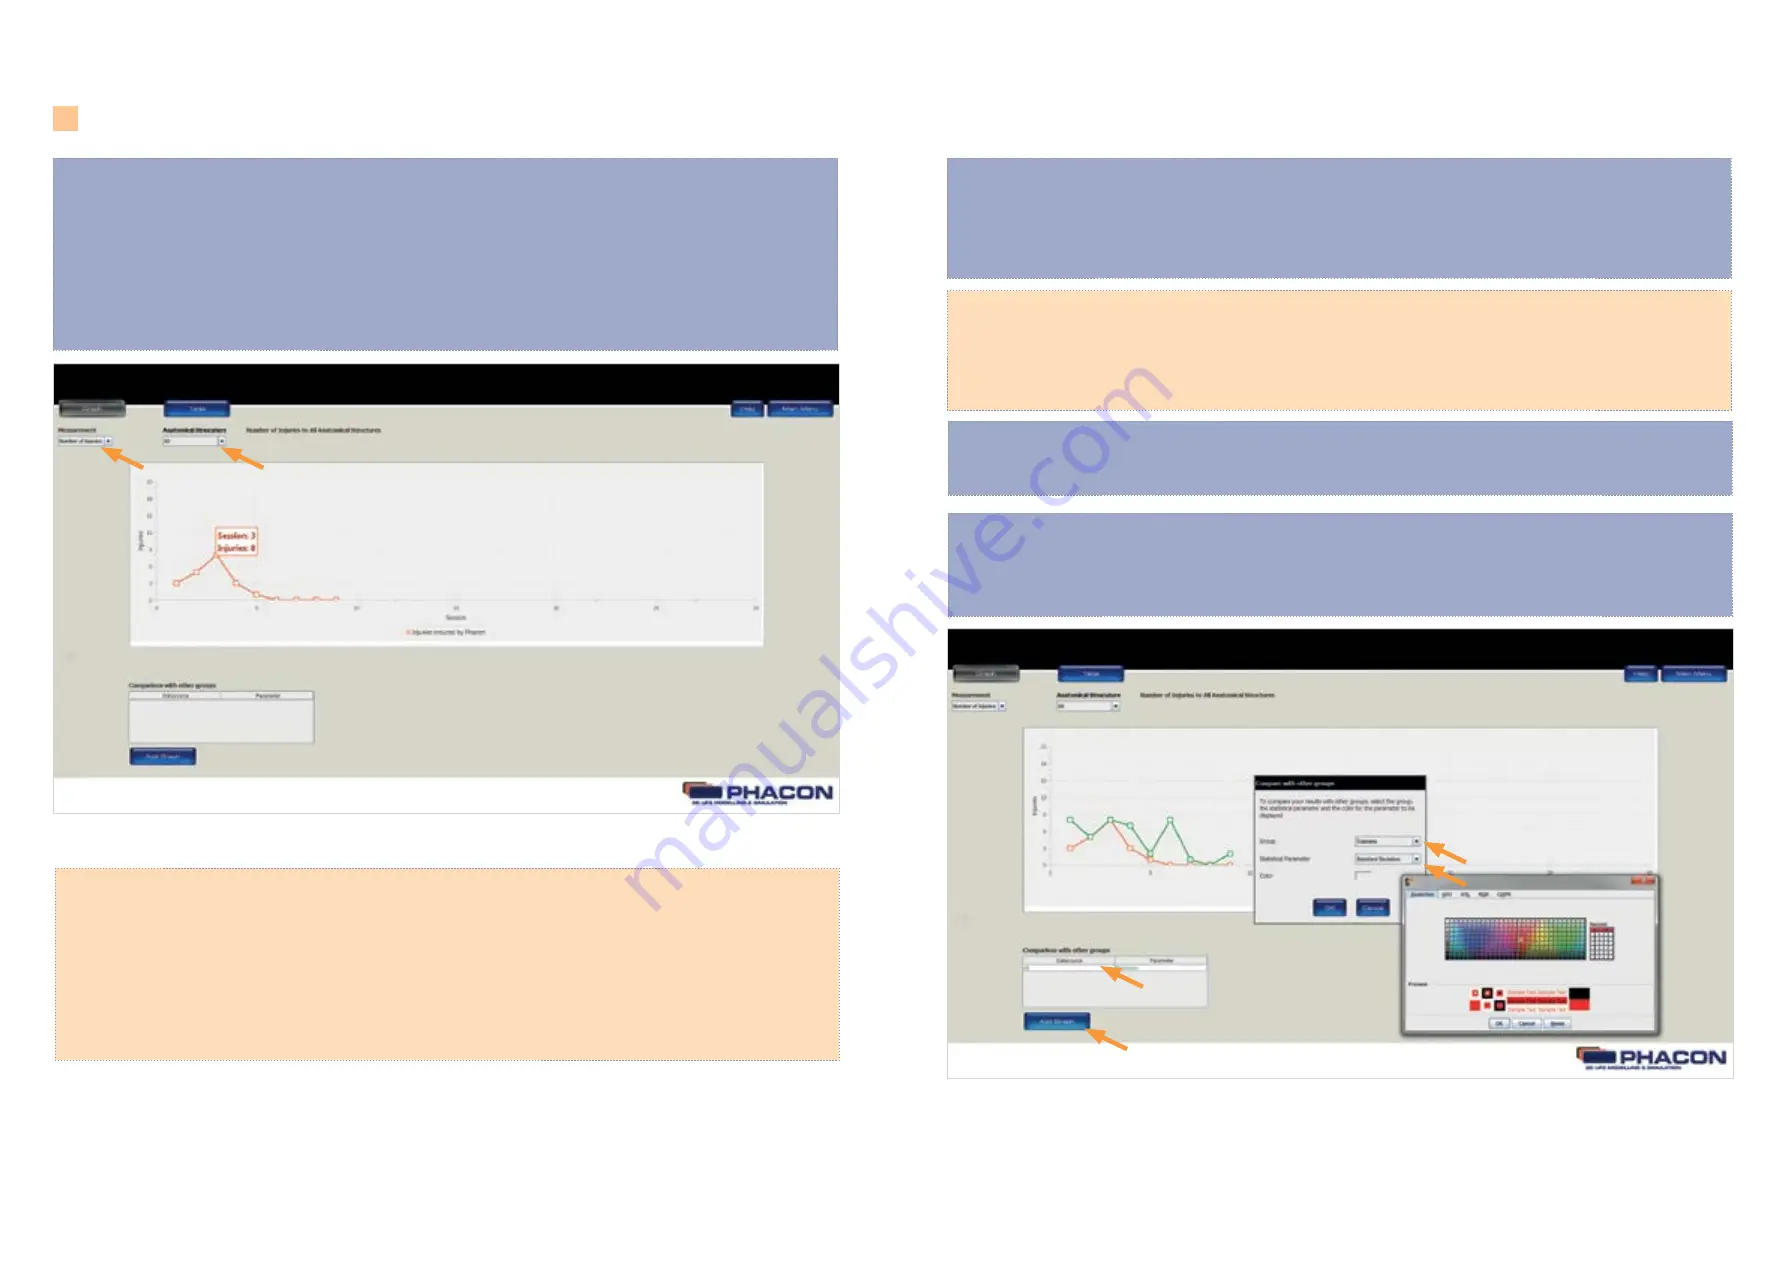
• The NUMBER OF INJURIES option will allow access to the ANATOMICAL STRUCTURE drop-down list.
(Fig.19)
4. Click on the ANATOMICAL STRUCTURE drop-down list.
5 . Select the ALL option or a specific risk structure to view the associated number of injuries
sustained during a particular training session.
OPERATE THE TRAINER
COMPARE WITH OTHER GROUP RESULTS
NOTE
The data collected during each training session is associated with the GROUP NAME select-
ed in the MAIN MENU. The training session results of each user may be compared with other
group results. (Fig. 20 ).
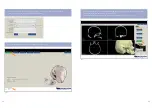
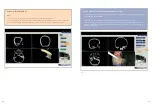
1. Click on the ADD GRAPH button to compare your results with other group results (Fig. 20 ).
2 . From the COMPARISON WITH OTHER GROUPS dialog box, click on the GROUP drop-down list and
select a group.
3. Click on the STATISTICAL PARAMETER drop-down list and select a statistical parameter.
NOTE
The STATISTICAL PARAMETER drop-down list includes maximum, minimum, mean, standard
deviation and median. The selected parameter is applied to the training session data.
4. From the COMPARISON WITH OTHER GROUPS dialog box, click on the COLOR bar and select a color.
A unique color is assigned to each selected group and the associated statistical parameter.
REMOVE A GROUP
To remove a group, click on the group name in the table COMPARE WITH OTHER GROUPS.
(Fig. 19)
(Fig. 20)


