Select™ Water charts
27
2.
Below
Reports
, select
Water usage chart
.
The window updates and adds information required to create the chart.
3.
Below
Report dates
, select the start and end dates. For more information, read
Selecting dates
on
page 25.
4.
Below
Your water meters
, select the water meter you want to view.
5.
Click
View chart
.
The chart displays.
6.
Click
Close
to return to the
Reports
window.
Viewing Water Flow Charts
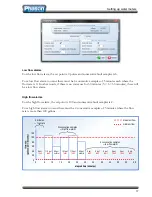
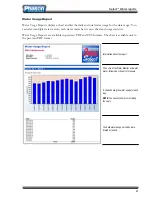
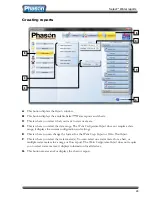
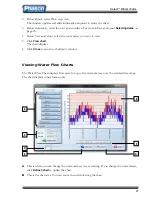
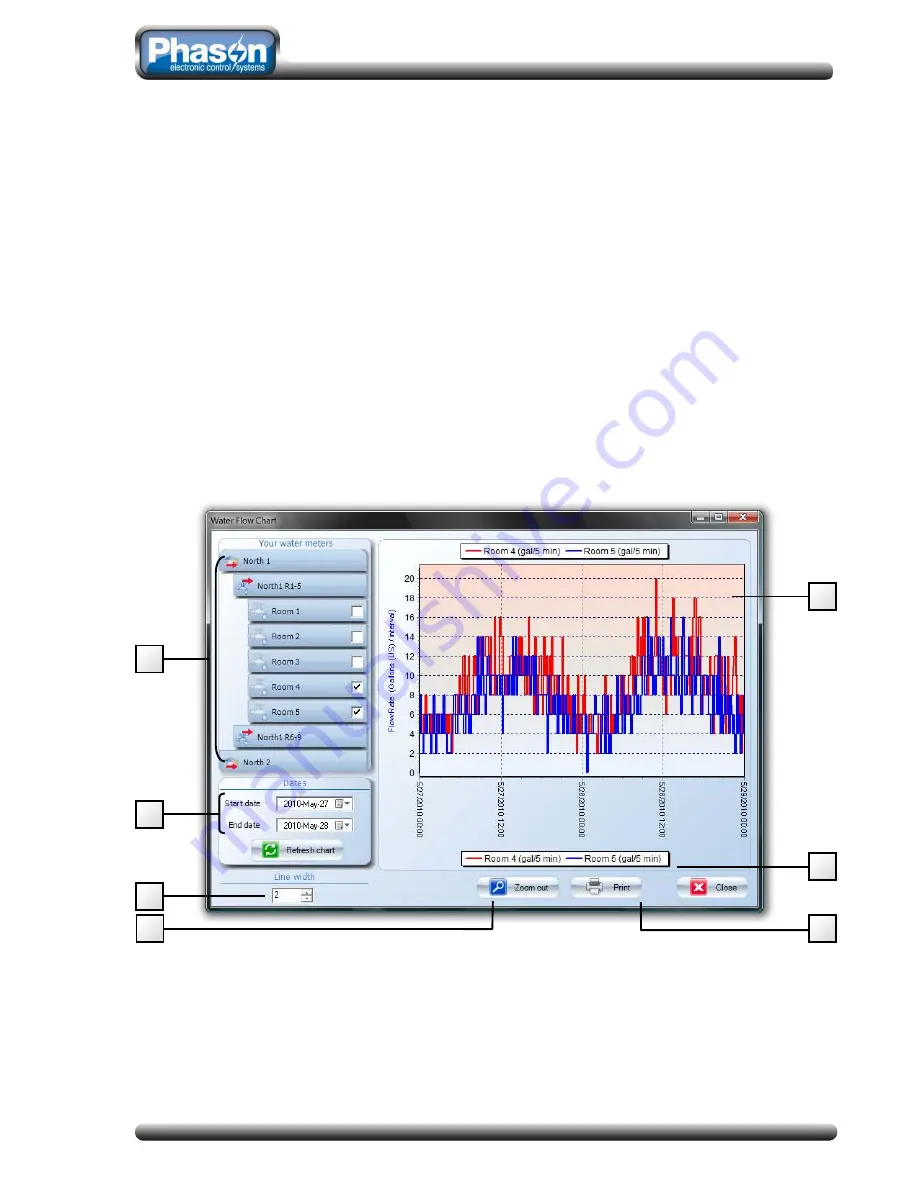
The Water Flow Chart displays flow rates for up to five water meters, over the selected date range.
The chart displays in line format only.
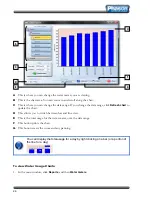
A
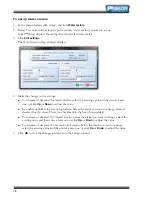
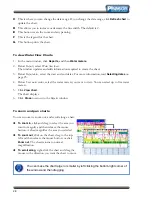
This is where you can change the water meters you are viewing. If you change the water meters,
click
Refresh chart
to update the chart.
B
This is the chart area. You can zoom in and scroll along the chart.
C
B
A
D
G
E
F

