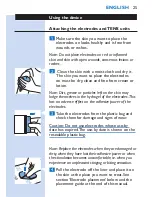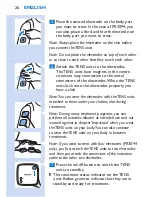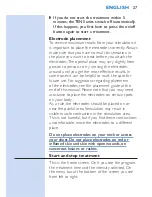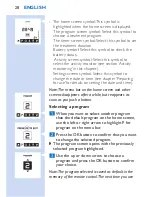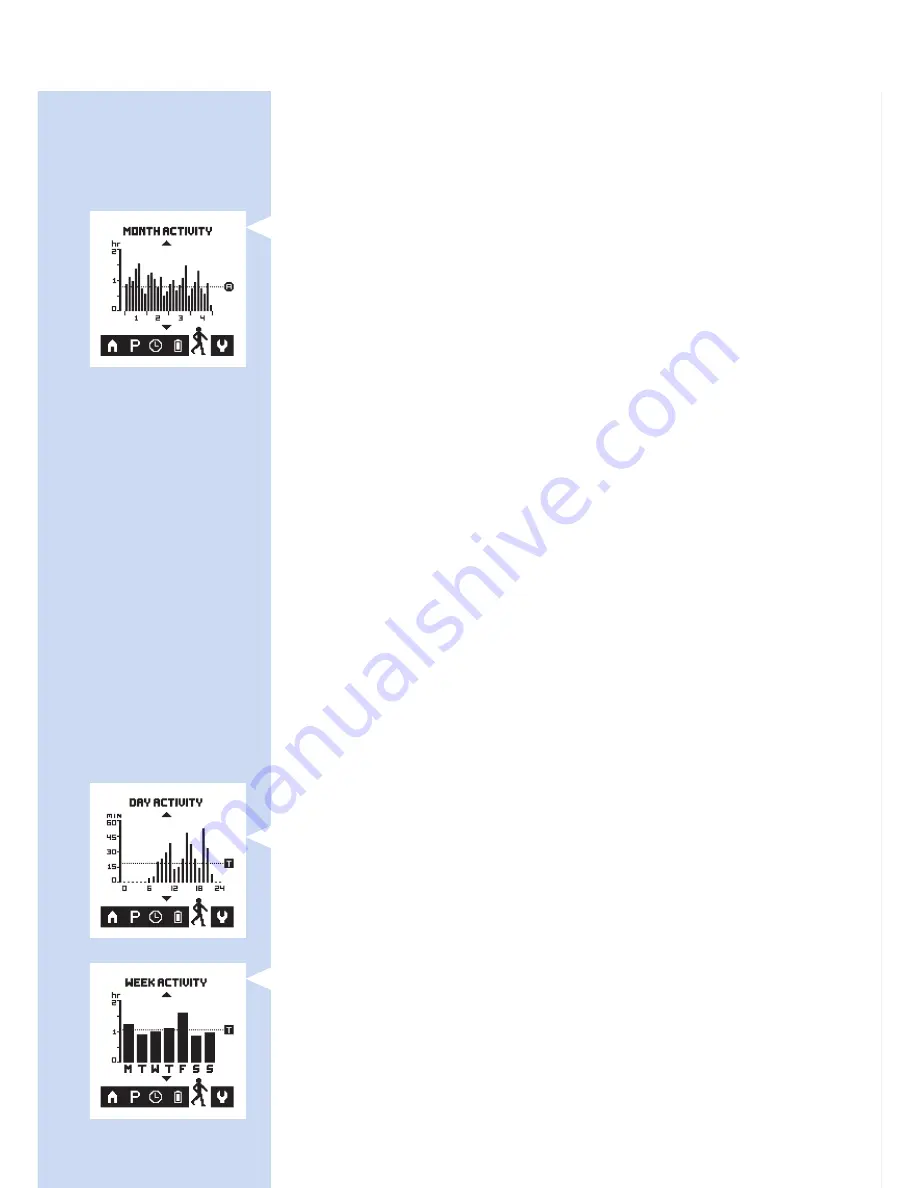
to establish if the activity level in the past week
was above or below average. It also allows you
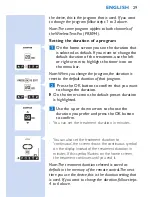
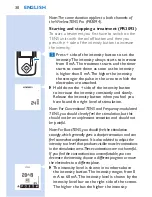
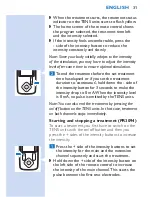
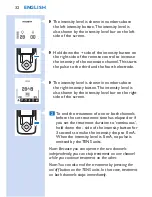
to establish on which days of the past week your
activity level was above or below average.
,
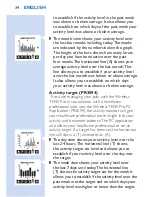
The month view shows your activity level over
the last four weeks including today. The weeks
are indicated by the numbers below the graph.
The height of the bars shows how many hours
per day you have been active over the past
four weeks. The horizontal line (A) shows your
average activity level over the last month. This
line allows you to establish if your activity level
over the last month was below or above average.
It also allows you to establish on which days
your activity level was above or below average.
activity target (PR3094)
If you are managing your pain with the Wireless
TENS Pro in consultation with a healthcare
professional who uses the Wireless TENS Pro PC
Application (PR3094), the activity monitor will give
your healthcare professional more insight into your
activity and treatment patterns. The PC application
also allows your healthcare professional to set an
activity target. If a target has been set, the horizontal
line will show a (T) instead of an (A).
,
The day view shows your activity level over the
last 24 hours. The horizontal line (T) shows
the activity target set level and allows you to
establish if your activity level over the day met
the target.
,
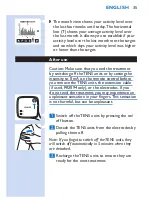
The week view shows your activity level over
the last 7 days until today. The horizontal line
(T) shows the activity target set for the week.It
allows you to establish if the activity level over the
past week met the target and on which days your
activity level was higher or lower than the target.
English
34
Summary of Contents for PR3093
Page 1: ...User manual PR3094 PR3093 ...
Page 2: ...1 ...
Page 3: ...PR3094 PR3093 English 4 Deutsch 57 Italiano 118 Français 176 ...
Page 235: ...101 ...
Page 236: ...4222 100 0803 1 05 2013 ...

