Instructions for Use | About Trilogy Evo Universal
Monitoring Window
16
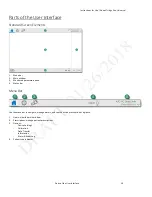
Types of monitoring windows
Monitoring windows may vary based on your model.
Views menu icon
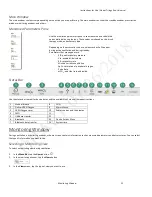
Monitoring window contents
Small manometer
-
Manometer pressure indicator
-
Set parameters
Measured and
calculated
parameters
-
Set parameters
-
Measured and calculated parameters
-
Additional parameters based on the prescription (including
accessories)
-
This is the default view.
An explanation of dynamic parameters is in chapter 3, “Therapy
Modes.”
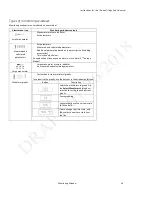
Large manometer
-
Large manometer pressure indicator
-
Six measured and calculated parameters
Waveform graphs
-
Customizable scalar waveform graphs
To customize the graphs, use the buttons in the window as follows:
Button
Description
Select the waveforms to graph. On
the
Select Waveforms
dialog box,
select data for the top and bottom
graphs.
Pause graphing.
Automatically size the vertical scale
to fit the data.
Tap to change the time scale, and
then select a new time scale from
the list.

