background image

TRIO-PS-2G/3AC/24DC/40

105907_en_00

PHOENIX CONTACT

19 / 25

15

Dynamic boost

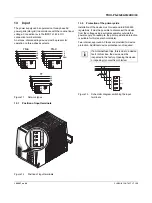
The following example is used to explain how the power 

supply dynamic boost functions.

Example:

The power supply supplies a connected base load of


80% 

until time point t

1

 (see illustration, schematic diagram of the 

dynamic boost behavior). If an additional load is activated 

while the power supply is in operation, the dynamic boost is 

requested for the period of time t

1

 to t

2

. The power supply 

provides the maximum dynamic power reserve of an 

additional 70%


(

Δ

P

dyn.


Boost


=


1.5


x


I

N


x


U

N


-


P

Initial load

).

As such, the requested overall total power corresponds to 

150%


of the nominal power. This power can be accessed 

directly for at least 5


s in the event that the output voltage 

remains the same. On reaching time point t

2

, the dynamic 

boost is once more returned to the output value of the base 

load for thermal offloading of the power supply. In this case, 

the base load amounts to the same value of


80%, as prior to 

time point t

1

. If the request to supply the load still exists, 

when the time intervals t

2

 to t

3

 have expired (at least 7


s), a 

new cyclical switching of the dynamic power reserve occurs, 

to a total of


70%.

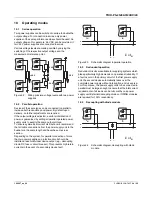
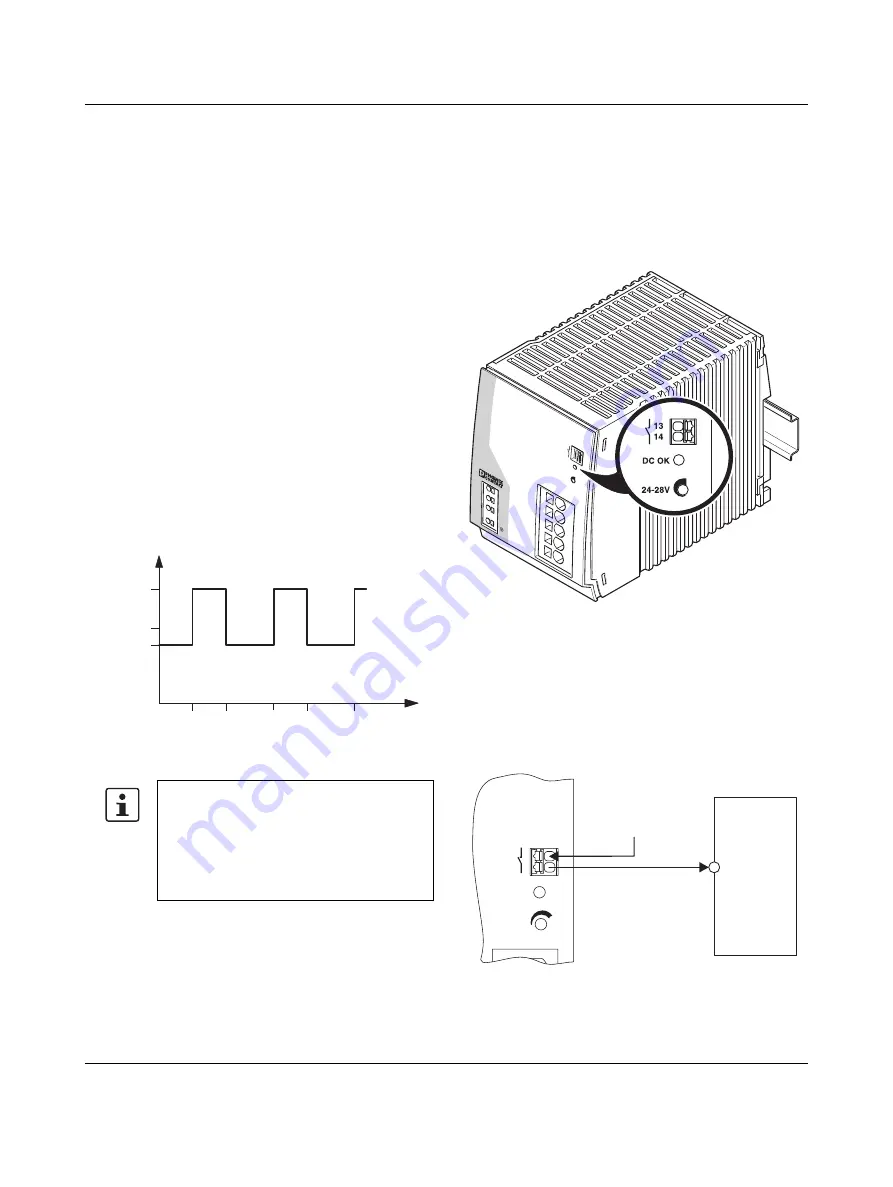
Figure 17

Schematic diagram of dynamic boost behavior

16

Signaling

16.1

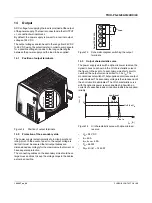
DC OK-LED

The DC OK-LED is available for function monitoring. The 

LED is continuously illuminated when the output voltage is 

>


90


% of the nominal output voltage U

OUT

 (24 V DC).

Figure 18

Location of the elements

16.2

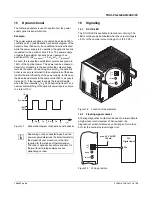
Floating signal contact

A floating diagnostics contact can be used to forward data to 

a higher-level control system. When opened, the 

diagnostics contact indicates an underrange of more than 

90% for the nominal output voltage U

OUT

.

Figure 19

Wiring principle

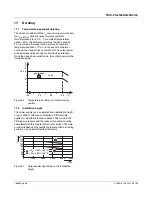
Depending on the connected base load, the 

power supply determines the time intervals for 

the dynamic boost procedure or the time 

required for the release of thermal tension. 

The ratio of dynamic boost time and time for 

thermal tension release always varies 

depending on load.

t [s]

t

1

...

5s

7s

5s

7s

t

2

t

3

t

4

t

5

I

OUT

[A]

I

dyn. Boost

80%

100%

L2

L3

L1

Input 3A

C 400-500V

13

14

DC OK

24-28V

Output DC 24V 40A

+

+

-

-

-

TRIO PO

WER

TRIO

P

24-28V

DC OK

13
14

PLC

Digital Input

DI x

max. 30 V AC/DC

100 mA

+

Summary of Contents for TRIO-PS-2G/3AC/24DC/40

Page 1: ...mic boost 1 5 x IN for 5 seconds Simplified error diagnostics for remote signaling via DC OK signal contact OVP Over Voltage Protection limits surge voltages to 30 V DC EN 61131 2 Technical data short...

Page 2: ...he customer 12 6 4 Performing high voltage testing 12 7 Basic circuit diagram 13 8 Structure 13 9 Cooling 14 10 Mounting position and dimensions 14 10 1 Mounting position 14 10 2 Device dimensions 15...

Page 3: ...20 17 1 Temperature dependent derating 20 17 2 Installation height 20 17 3 Position dependent derating 21 18 Operating modes 24 18 1 Series operation 24 18 2 Parallel operation 24 18 3 Redundant opera...

Page 4: ...tronic locking of the set nominal currents For installation on DIN rails CBM E8 24DC 0 5 10A NO R 2905744 1 VARIOFACE module with two equipotential busbars P1 P2 for potential distribution for mountin...

Page 5: ...typ 3 5 mA 2 5 mA 550 V AC 60 Hz Mains buffering 10 ms 400 V AC 20 ms 480 V AC Inrush surge current I2t 1 1 A2s Switch on current surge limitation typical after 1 ms 35 A During the first few microsec...

Page 6: ...ircuit current 48 A DC Permanent Control deviation change in load static 10 90 1 Control deviation Dynamic load change 10 90 10 Hz 3 Control deviation change in input voltage 10 0 1 Short circuit proo...

Page 7: ...m 1 5 mm Stranded conductor cross section with ferrule 0 2 mm 1 5 mm Conductor cross section AWG 24 16 Stripping length 8 mm Reliability 400 V AC MTBF IEC 61709 SN 29500 1730000 h 25 C 1051000 h 40 C...

Page 8: ...5 Hz 1 6 mm amplitude 25 Hz 100 Hz 4g acceleration Shock 18 ms 30g in each space direction according to IEC 60068 2 27 Degree of pollution 2 Climatic class 3K3 in acc with EN 60721 Overvoltage categor...

Page 9: ...ndustrial environments Higher requirements in practice covered Electrostatic discharge EN 61000 4 2 Housing contact discharge 4 kV Test Level 2 6 kV Test Level 3 Housing air discharge 8 kV Test Level...

Page 10: ...age dip on 40 10 periods Test Level 2 40 10 periods Test Level 2 Comments Criterion C Criterion B Voltage dip on 0 1 period Test Level 2 0 1 period Test Level 2 Comments Criterion B Criterion B Immuni...

Page 11: ...lf but replace it with an equivalent device Repairs may only be carried out by the manufacturer The manufacturer is not liable for damage resulting from violation CAUTION Before startup please ensure...

Page 12: ...gh voltage test is performed with a test voltage of at least 1 5 kV AC 2 2 kV DC or higher Routine manufacturing tests are inspected regularly by a certification body 6 3 High voltage dielectric test...

Page 13: ...r Filter Floating switching output L1 L2 L3 13 14 No Description of the function elements 1 Connection terminal block input voltage Input L1 L2 L3 2 Connection terminal block output voltage Output DC...

Page 14: ...without minimum lateral clearance up to an ambient temperature of 40 C In a temperature range up to 70 C a lateral minimum clearance of 10 mm between two active components e g power supply is require...

Page 15: ...907_en_00 PHOENIX CONTACT 15 25 10 2 Device dimensions Figure 6 Device dimensions Output DC 24V 40A 13 14 DC OK 24 28V L2 L3 L1 160 167 130 45 80 15 Input 3 AC 400 500V 23 5 10 24 7 5 16 100 13 88 27...

Page 16: ...on technology on the front The power supply is wired by simply plugging in the connecting cables no tools are required For the necessary connection parameters for the terminal blocks please refer to t...

Page 17: ...sible to disconnect the device from the voltage using a suitable separator outside the power supply For example the primary side line protection is suitable for this see technical data Two internal ap...

Page 18: ...protection The connecting cables on the secondary side should have large cross sections to keep the voltage drops in the cables as low as possible Figure 15 Schematic diagram switching the output ter...

Page 19: ...equest to supply the load still exists when the time intervals t2 to t3 have expired at least 7 s a new cyclical switching of the dynamic power reserve occurs to a total of 70 Figure 17 Schematic diag...

Page 20: ...ce has cooled down the output power will be increased again Figure 20 Temperature derating in normal mounting position 17 2 Installation height The power supply can be operated at an installation heig...

Page 21: ...position derating should be adhered to The characteristic curve can be used to determine the maximal output power to be drawn for each ambient temperature for different mounting positions Normal mount...

Page 22: ...T 22 25 Rotated mounting position 180 X axis Rotated mounting position 270 X axis Z X Y IN 1 5 x IN 25 0 10 20 30 40 50 60 70 80 C A Output DC 24V 40A L 2 L 3 L 1 TRI O POW ER 13 14 2 4 2 8 V D C O K...

Page 23: ...g position 90 Z axis Rotated mounting position 270 Z axis X Y Z IN 1 5 x IN 25 0 10 20 30 40 50 60 70 80 C A X Y IN 1 5 x IN 25 0 10 20 30 40 50 60 70 80 C A Z 1 3 I n p u t 3 A C 4 0 0 5 0 0 V O u t...

Page 24: ...end that all cable connections from the power supply unit to the busbar are the same length and have the same cross section Depending on the system for parallel connection of more than two power suppl...

Page 25: ...increased to n x IN in the case of n parallel connected devices Parallel connection for increasing power is used when extending existing systems A parallel connection is recommended if the power suppl...

Reviews: