www.hartmann-electronic.com
Rev. 1.2
25
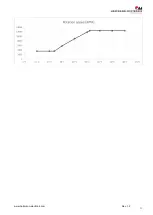
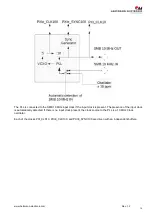
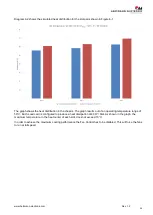
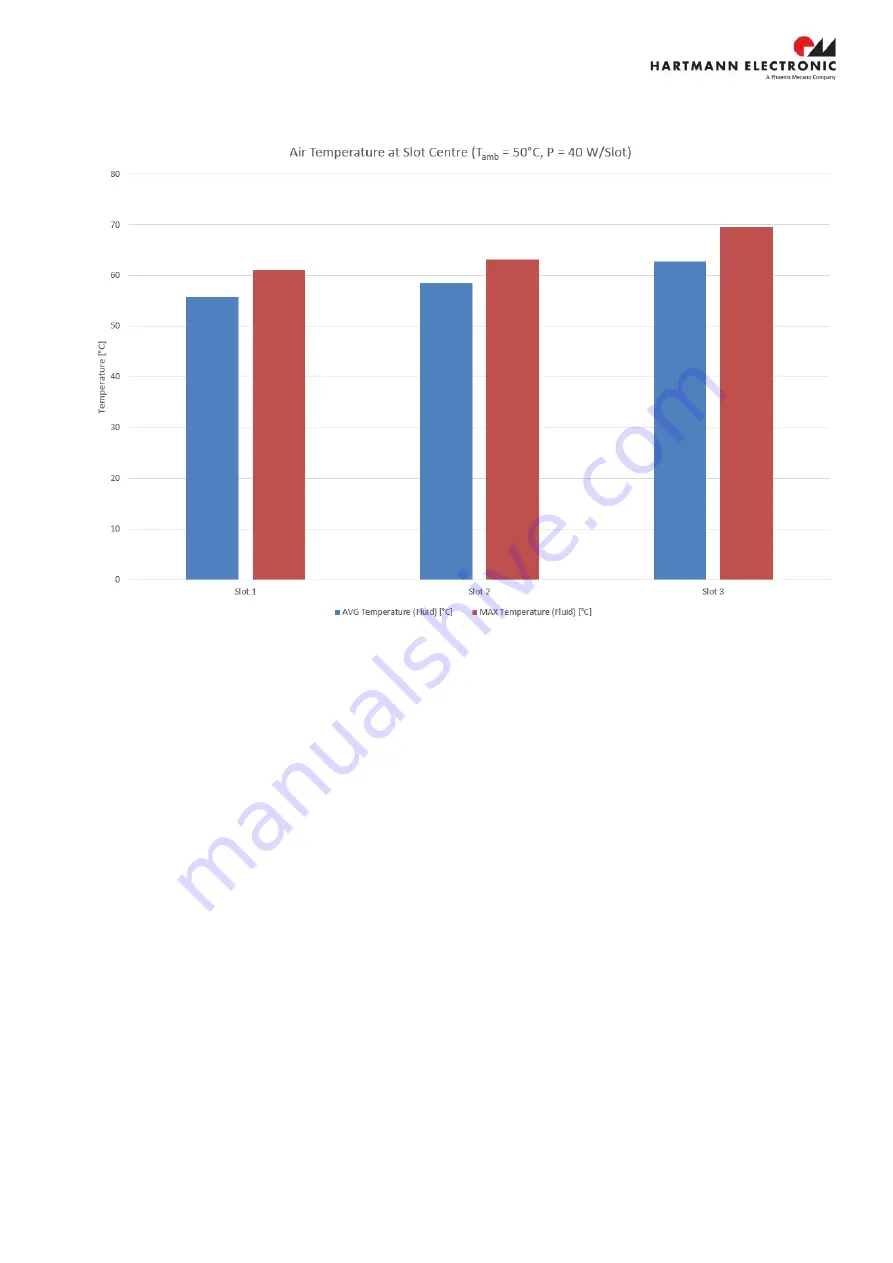
Diagram 6-2 shows the simulated heat distribution for the slot pairs shown in Figure 6-1
The graph shows the heat distribution in the chassis. The graph results out of an operating temperature range of
50°C. Each Load card is configured to produce a heat dissipation of 40 W / Slot. As shown in the graph, the
maximum temperature, in the heat center of each slot, does not exceed 70°C.
In order to achieve the maximum cooling performance the Fan Control has to be disabled. This will force the fans
to run at full speed.


