0
50
100
150
200
250
300
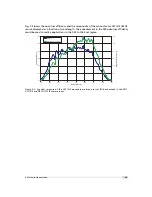
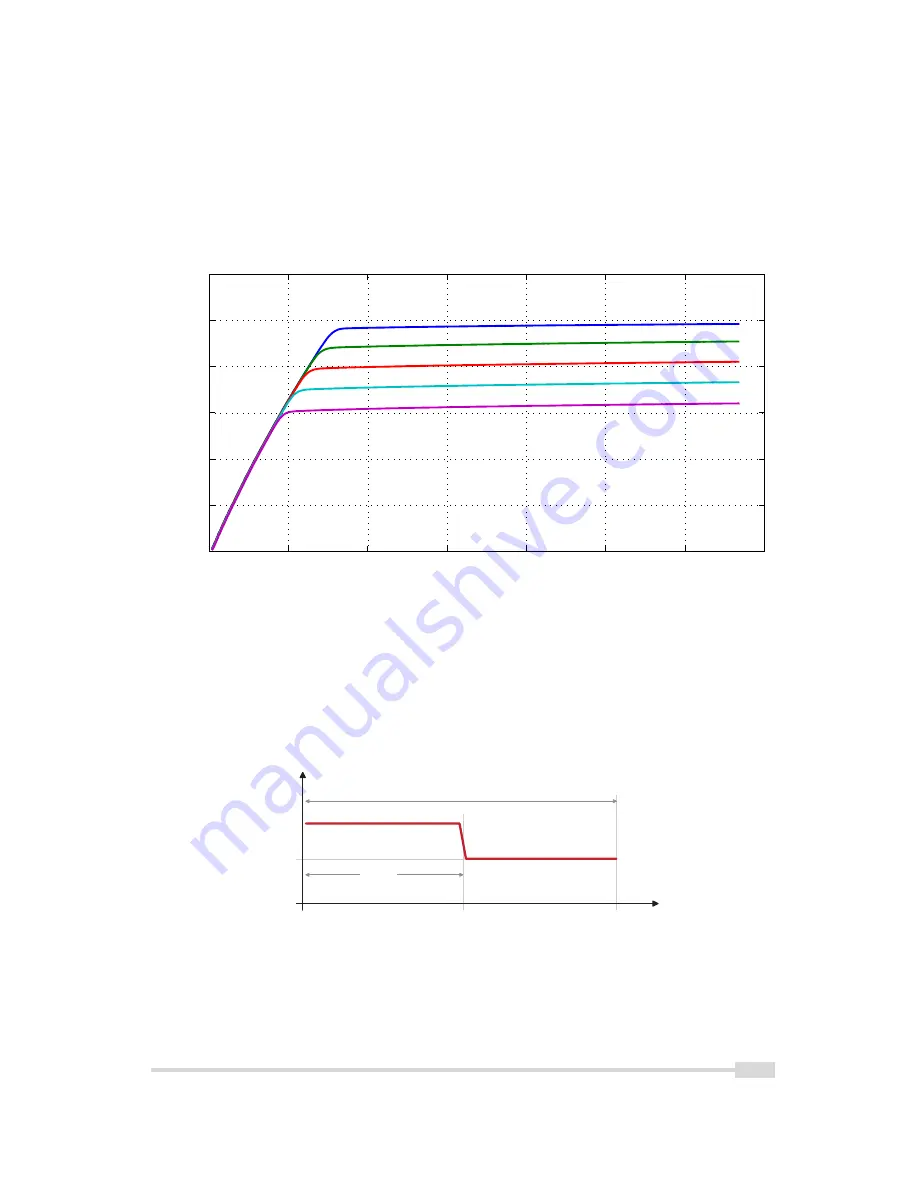
Typical LinLog1 Response Curve − Varying Parameter Value1
Illumination Intensity
Output grey level (8 bit) [DN]
V1 = 15
V1 = 16
V1 = 17
V1 = 18
V1 = 19
Time1=1000, Time2=1000, Value2=Value1
Figure 4.12: Response curve for different LinLog settings in LinLog1 mode
tt
V a l u e 1
V a l u e 2
T i m e 1
t
e x p
0
V
L i n L o g
T i m e 2 = m a x .
= 1 0 0 0
T i m
e 1
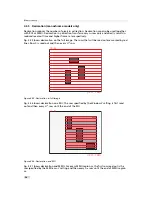
Figure 4.13: Voltage switching in the Linlog2 mode
4.2 Pixel Response
41
Summary of Contents for DR1-D1312(IE)-G2
Page 2: ......
Page 4: ...2...
Page 8: ...CONTENTS 6...
Page 14: ...2 How to get started GigE G2 Figure 2 3 PFInstaller components choice 12...
Page 96: ...4 Functionality 94...
Page 122: ...6 Software 120...
Page 128: ...8 Warranty 126...
Page 130: ...9 References 128...


