What the Eagle™ Records
••••
39
Using the Eagle™
The Eagle can record every available record type simultaneously.
Each record type has its own fixed memory allocation, so there is
no danger of one errant record type filling the Eagle memory to
the exclusion of other record types (for example, event capture
can never overflow into interval graph memory). Thus the choice
usually is not which record types to record, but which record types
to examine. In order to answer that question, a good
understanding of each record type is required. The details of each
record type, and potential uses, are described in the following
subsections.
Interval Graphs
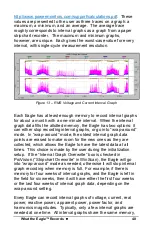
The interval graph is one of the most useful record types. In a
single interval graph, you can see power quality events such as
single-cycle voltage sags and current surges, as well as long-term
voltage trends. With the graph, one can examine an entire
recording session at a glance.
What is Recorded
The only setting for the interval graph is the interval. This interval,
which can be as small as one cycle to as large as four hours,
determines how often the recorder takes an interval graph data
point. Every interval graph the Eagle is recording uses the same
interval settings. During the interval period, the Eagle keeps a
history of the largest and smallest one-cycle values for each
interval graph, as well as a running average. At the end of the
interval, the maximum, minimum, and average values for that time
period are recorded as an interval graph data point. For example,
if the interval is set to one minute (a typical setting), at the end of
each minute, the voltage interval graph will record the average
root-mean-square (RMS) voltage, the minimum one-cycle RMS
voltage, and the maximum one-cycle RMS voltage, all during that
minute. All of the 3600 cycles that occur during that minute are
used to calculate the average, and for maximum and minimum
detection. For more information on these calculations, please see
“Calculations” at


