background image


Appendix 2: Frequently Asked Questions (FAQs)  

••••


 80 

10) Answer “Yes” to “Would you like to initialize with 

these settings?” 
 

How should I interpret the data recorded by my 
Eagle? 

1)  See “Understanding Scanner Records” on the 

website at 

http://www.powermonitors.com/support/understandi
ng.pdf

, or on the CD included with your Eagle.  If 

that does not help, call 1-800-296-4120. 
 

How do I import older WinScan data files for use 
with ProVision? 

1)  In ProVision, select [File] then [Import]
2)  Locate and select the folder containing your 

WinScan data files. 

3)  Answer “Yes” to “Should the folder be added 

recursively?” 

4)  The WinScan data files should now be displayed in 

the explorer tree in the under the “Imported Files” 
folder. 
 

How do I change the scaling (upper or lower 
bounds) on a graph? 

1)  While looking at a graph, select [Tools] and then 

[Upper/Lower Bounds]

2)  In the “Upper/Lower Bounds” window, select 

“Manual Scaling.” 

3)  You can now change the upper and lower bounds 

to values of your choice.  If you would like to set the 
bounds to all plots, simply click [Set all scales to 
this scale]
 after typing in your desired bounds. 


Summary of Contents for Eagle 220

Page 1: ...Eagle Power Quality Recorder User s Manual Power Monitors Inc Eagle User s Manual 28 March 2008 Eagle Power Quality User s Manual...

Page 2: ......

Page 3: ...Eagle Power Quality Recorder User s Manual...

Page 4: ...er caused In no event shall the copyright owner or contributors be liable for any business interruption or loss of use data or profits on any theory of liability whether in contract strict liability o...

Page 5: ...nputs 11 Instrument Size and Construction 11 System Description 12 Applications 12 Memory 12 USB Communications 13 Bluetooth Wireless Communications 13 Eagle Accessories 13 TLARs 14 Ultra Slim Flexibl...

Page 6: ...der 35 What the Eagle Records 37 Triggered Record Types 37 Non triggered Record Types 38 Using the Eagle 39 Interval Graphs 39 Daily Profiles 44 Cycle Histograms 46 Minute Histograms 49 Energy Usage 5...

Page 7: ...on 31 Figure 11 PMI Field PC 33 Figure 12 A Palm PDA Running pmiScan 35 Figure 13 RMS Voltage and Current Interval Graph 40 Figure 14 RMS Voltage Daily Profile Graph 44 Figure 15 RMS Voltage Cycle His...

Page 8: ......

Page 9: ...he danger of hazardous voltages on the input connection leads of your Eagle power quality recorder USE EXTREME CAUTION WHEN CONNECTING your instrument Hazardous potentials exist on signal input leads...

Page 10: ...INTEGRITY OF THE HOUSING do not attempt to remove the sealed lid or otherwise disassemble the unit THERE ARE NO USER SERVICEABLE PARTS INSIDE THE RECORDER This device is manufactured for use by train...

Page 11: ...reinforced insulation Caution This mark indicates that caution should be exercised due to of danger Refer to the safety specifications on page 1 and the installation procedure on page more informatio...

Page 12: ......

Page 13: ...software WinScan and all documentation USB communications cable Banana plug voltage leads and clips If any of these items are missing please call PMI immediately at 1 800 296 4120 The CD ROM includes...

Page 14: ......

Page 15: ...y operate on the voltage from one of the attached lines There are no batteries to recharge prior to use Each unit has been individually calibrated to ensure high accuracy and stability over a wide ran...

Page 16: ...cement power factor real power apparent power reactive power volt amps frequency phase angle and more Power outage report Abnormal voltage report Current or voltage out of limits report Significant ch...

Page 17: ...ata recording the average minimum and maximum readings for a selected interval with one cycle resolution Even events lasting less than one cycle are revealed in ProVision and WinScan reports if the co...

Page 18: ...p computers or a PMI Field PC For more information on viewing real time data please refer to the ProVision and pmiView manuals You can then view and analyze the data using our ProVision or WinScan sof...

Page 19: ...truction The Eagle recorder is contained in a 5 inch 136 5 mm inch 60 3 mm by 1 13 16 inch 46mm NEMA 4X sealed box suitable for outdoor installation Servicing should only be performed by PMI High volt...

Page 20: ...real time viewing of waveforms harmonic bar graphs vectors as well as numeric values Applications An Eagle recorder may be configured to record and monitor almost any voltage and current configuration...

Page 21: ...the Eagle must be powered using the Channel 1 and Common input jacks or by battery ride Refer to the appropriate software manual for detailed communications information and instructions Eagle Accessor...

Page 22: ...s PMI has a wide range of Flexible CTs that range in circumference from 12 to 48 inches and have ranges of 100 1000 and 5000 Amps All our flexible CTs are powered from the unit itself so no external b...

Page 23: ...lips for your application dolphin style clips lower come standard with every unit and the alligator style clips are optional at an additional cost Figure 6 Voltage Clips 15 of voltage clips for your a...

Page 24: ...THD Capacity Summary data Over 1 year Event data 1000 records Flicker data 1000 records Interval Graphs 4 hrs to over 1 yr Record Settings Interval Graphs 1 cycle to 4 hours Significant change 1V to 8...

Page 25: ...nformation contained in this section When purchasing a new Eagle recorder review the manual for that recorder as information in manuals received with older Eagle recorders may not pertain to your reco...

Page 26: ...ecorder for more than one year If longer storage time is required contact the factory for additional storage information ENVIRONMENTAL PRECAUTIONS To assure optimum performance and safety observe the...

Page 27: ...sewhere minutes later A small rechargeable NiMH ride through battery powers the unit for up to 2 hours during a power outage while the Eagle is in record mode This battery should be replaced by PMI on...

Page 28: ...onnect to the nine pin connector on the top of the Eagle housing The recorder automatically detects the current rating of the CT connected during the two minute initialization countdown which starts w...

Page 29: ...channel These leads are color coded as follows Channel Lead Phase Channel 1 Black A Channel 2 Red B Channel 3 Blue C Channel 4 Yellow N Common White Common Attach the clip leads to voltage lines in a...

Page 30: ...in mind The banana jacks are color coded by channel Black is Channel 1 Red is Channel 2 Blue is Channel 3 Yellow is Channel 4 and White is common The unit is powered from the voltage between Channel...

Page 31: ...mmon White 3 Channel 4 Yellow 4 Channel 3 Blue 5 Channel 2 Red 6 Channel 1 Black On the following page are diagrams showing several basic circuits and possible ways to connect them using your Eagle re...

Page 32: ...Connecting the Eagle 24 Figure 8 Eagle Hookup Diagrams...

Page 33: ...llow 4 Channel 3 Blue 5 Channel 2 Red 6 Channel 1 Black If the Eagle is not disconnected in this manner and recording has not been stopped via software it will continue recording on battery ride throu...

Page 34: ...munications cable is configured and wired to conform to the industry standards for USB communication Important To maintain operator safety do not connect the USB cable to the recorder s communications...

Page 35: ...s possible when requesting technical assistance Initialization The Eagle recorders must be initialized before recording data This is done by either connecting the recorder to your computer using the U...

Page 36: ...you may use Bluetooth with some Palm PDAs see PDA Communications with Eagle Recorders or a PMI Field PC see Field PC Communications with Eagle Recorders The Eagle will stop recording whenever the reco...

Page 37: ...ecorded data is still in the Eagle and can be downloaded again even after it has been re initialized if you have not yet begun a new recording session The data is not erased until the end of the two m...

Page 38: ......

Page 39: ...laptop or desktop PC using ProVision or WinScan Identify recorder to display serial number firmware version and any options Initialize recorder with customized user selected settings Set the date and...

Page 40: ...the cable a 4 pin female connector into the communications port on the Eagle The unit is powered through the USB connection The green LED illuminates to indicate that it is in communications mode and...

Page 41: ...th the Eagle using Bluetooth wireless technology However the Eagle must be powered either by Channel 1 voltage greater than 80VAC battery ride through in the case of a power outage in order to communi...

Page 42: ......

Page 43: ...er is connected or from battery ride The following operations can be performed using a Palm and the pmiScan and pmiView software Identify the recorder Initialize the recorder Download recorded data Vi...

Page 44: ...DA pmiScan has two modes LDU which stands for Local Display Unit and Comm Communication LDU allows the user to scroll through a series of screens showing real time displays of the measurements that ha...

Page 45: ...l report which just shows the important events and measurements The sifting of data into specific record types accomplishes this task Triggered Record Types Eagle records can be divided into two class...

Page 46: ...veform capture Non triggered Record Types The second class of record types is not event driven These record types are always logging data regardless of how interesting important or unimportant the dat...

Page 47: ...ntire recording session at a glance What is Recorded The only setting for the interval graph is the interval This interval which can be as small as one cycle to as large as four hours determines how o...

Page 48: ...n wrap around mode the oldest interval graph data points are erased to make room for the new ones as they are collected which allows the Eagle to have the latest data at all times This choice is made...

Page 49: ...tage minimum of 90V RMS during an interval graph interval with the interval set to 15 minutes you are sure that voltage dipped that low for at least a cycle but you do not know when or how often or ho...

Page 50: ...minutes doubles the recording time without a serious loss of time resolution Other common settings are five and fifteen minutes used to match metering or billing increments or regulatory time periods...

Page 51: ...ngle Power factor Displacement power factor Voltage THD total harmonic distortion Current THD total harmonic distortion Frequency IFL Instantaneous flicker level PST Perception short term flicker The...

Page 52: ...hannel in a recording session For example there are four voltage daily profiles recorded for an Eagle 440 in a recording session one per channel The profile is averaged over the entire recording sessi...

Page 53: ...ewhat of an exception in that anywhere can be good place to create a profile every other load at least those nearby will see the same distribution line voltage The ideal location for creating power fa...

Page 54: ...wer more complicated statistical questions such as What is the probability of a voltage sag below 100V and What high and low limits does the line voltage meet 99 99 of the time While the daily profile...

Page 55: ...ph shows six sags to 108V sometime during the recording session there should be a count of at least six in the histogram at 108V The count will probably be somewhat larger unless each individual sag w...

Page 56: ...sion If the count at 111V is 1 352 200 then the voltage was at 111V for over 6 hours 1 352 200 6 26 60 60 60 By totaling the counts for all the bins in a voltage range for example 0 to 150V you find h...

Page 57: ...if the voltage were 123V for 55 seconds then 115V for 5 seconds the average would be 122V and the 122V bin counter would be incremented If the interval graph interval is also set to one minute then th...

Page 58: ...e easier to read since the fast one cycle events have been averaged out Energy Usage The energy usage report shows the accumulated real reactive and apparent power measured by the Eagle The accumulate...

Page 59: ...Energy Usage Report Typical Settings and Suggested Uses There are no settings for the energy usage report This report can be used to measure energy consumption of a monitored load or accumulated reac...

Page 60: ...d during the recording session the largest and smallest RMS voltages for that second are compared with the standard significant change voltage This standard voltage starts as the nominal voltage picke...

Page 61: ...se created a 2Vdifference between the 121 maximum voltages for that second and the 119V standard The standard voltage is now set to 121V until the next significant change Only one significant change p...

Page 62: ...e voltage is fluctuating If there are no significant change records then there were no fluctuations greater than the threshold A significant change record can be correlated with the interval graph by...

Page 63: ...ance triggered waveform capture the raw waveforms of each voltage and current channel can be displayed Again the significant change timestamp is used to find the waveform in the list of captured wavef...

Page 64: ...eter is the threshold in volts The threshold is added and subtracted to the nominal to form voltage trip points These trip points are created all the way down to zero volts and up to the maximum recor...

Page 65: ...hen an event change is triggered the trigger time is recorded with one cycle resolution The RMS current one cycle before the trigger is recorded The direction of the voltage change or slope is also re...

Page 66: ...or example if no sags such as from motor starts etc will take longer than 6 cycles for the voltage to drop to the sag value the best minimum event time is 7 cycles This will prevent multiple event cha...

Page 67: ...rent is lower than the in rush current but higher than the current before the event Another possibility is a voltage sag where the current during the event is lower than the pre trigger current or abo...

Page 68: ...least one third of a second Only channel 1 voltage is used to trigger an outage The beginning and end of the outage are time stamped In the report the duration is also given along with the total numbe...

Page 69: ...a limit on their quantity in certain time spans The default parameters conform to IEEE Standard 141 and can be adjusted in ProVision For more information on flicker parameters see the ProVision docume...

Page 70: ...ume 120V incandescent and customer sensitivity The flicker report is used both to confirm a customer complaint about flickering lights and to measure progress in mitigating a problem If no flicker eve...

Page 71: ...ering logic uses a low and high threshold a nominal voltage and a trigger duration The thresholds are added and subtracted to the nominal voltage to find triggering points If the voltage crosses a tri...

Page 72: ...ing closer to 240V than 230V at that time The nominal voltage is chosen by the Eagle separately for each voltage channel There are separate high and low thresholds for each of the seven nominal voltag...

Page 73: ...g the recording session Typically the abnormal voltage report is used to get a quick read of whether there was any line voltage drift if so other record types such as the interval graph and significan...

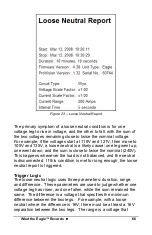
Page 74: ...the nominal 240V This happens whenever the load is not balanced and the neutral is disconnected If this condition is met for long enough the loose neutral report is triggered Trigger Logic The loose...

Page 75: ...ired 12V specified by the range value of twice the nominal 240V If these voltages persist for 5 seconds in a row then a loose neutral record will be triggered If one voltage leg changes due to heavy l...

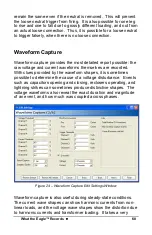
Page 76: ...s are recorded With clues provided by the waveform shapes it is sometimes possible to determine the cause of a voltage disturbance Events such as capacitors opening and closing reclosers operating and...

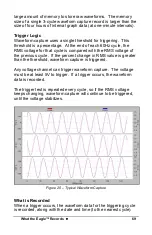
Page 77: ...S voltage of the previous cycle If the percent change in RMS value is greater than the threshold waveform capture is triggered Any voltage channel can trigger waveform capture The voltage must be at l...

Page 78: ...the waveform capture memory is full before the end of the event and the unit is in wrap around mode the Eagle automatically erases cycles of the earliest record to make room for the new data If the un...

Page 79: ...age length of the sag or swell and the coupling from phase to phase are easily seen in the graph Sometimes there are clues regarding the cause of a voltage disturbance A voltage sag that starts in the...

Page 80: ...resent Often the current waveforms will not be sinusoidal The less they look like a sine wave the higher the level of current harmonics Frequently the neutral current looks much less sinusoidal than t...

Page 81: ...ocument can also be found on the website at http www powermonitors com support understanding pdf Technical Support Help is always available if one needs additional assistance The technical support at...

Page 82: ...24 hours a day 7 days a week for live tech support by calling 800 296 4120 Faxes should be sent to 540 432 9430 Postal Mail Support All correspondence by post should be addressed to Power Monitors In...

Page 83: ...ducts that have been subject to misuse alteration accident or for repairs not performed by PMI The foregoing warranty constitutes PMI s sole liability and is in lieu of any other warranty of merchanta...

Page 84: ...ce Equipment returned to PMI must be shipped with freight charges prepaid After repair PMI will return equipment F O B factory If equipment is repaired under warranty obligation freight charges exclud...

Page 85: ...e device using ProVision 2 Identify the recorder by clicking Recorder and then selecting Identify 3 After the identification is complete click on View and the View Identification Information window wi...

Page 86: ...Operations 13 Select the Eagle in the devices tree right click on the device and select Upload firmware 14 A pop up box should either say Files containing new version not found or Firmware upgrade ne...

Page 87: ...on 2007 to export to it using more than 65 000 lines 1 Open the data file 2 Right click the file and select Export to Word or Export to Excel How do I save my favorite Eagle initialization settings fo...

Page 88: ...ct File then Import 2 Locate and select the folder containing your WinScan data files 3 Answer Yes to Should the folder be added recursively 4 The WinScan data files should now be displayed in the exp...

Page 89: ...charge the customer in order to make it easier to use our equipment and software How can I get notified of updated versions of ProVision as they are released 1 You can register to get email updates f...

Page 90: ......

Page 91: ...s and missing connector pins 2 If you are using a laptop PC make sure that any energy saving features on the Windows operating system are turned off Sometimes the PC will shut down communications in a...

Page 92: ...communications or download problems after trying all of the above then there is possibly a hardware problem in the recorder 6 Find the Communications Troubleshooting document at http www powermonitor...

Page 93: ...ons when installing 21 TLARs 2 14 20 25 Ultra Slim Flexible CTs 2 14 20 21 25 Cycle Histograms 44 46 Dolphin clips See Voltage clip leads Downloading Data 31 35 78 E mail Support 73 Energy Usage 50 En...

Page 94: ...9 10 11 19 21 25 26 27 28 29 31 32 40 43 57 59 61 73 77 78 79 80 81 83 84 Returns See Equipment Return Significant Change 52 Technical Support 73 74 Triggered Records 52 56 61 63 66 69 Troubleshooting...

Page 95: ......

Page 96: ......

Reviews: